

Buck converter efficiency is useful when the input voltage, output load, temperature and measurement boundary are known. When a supplier proposes a high-efficiency buck converter, request the operating points behind that description. A published percentage without those conditions cannot define the heat loss in every installation. For an OEM comparison, reproduce the input/output power calculation before deciding whether two claims are comparable.
The practical output is a measurement record: power entering the converter, useful DC power leaving it and the difference between them. This article addresses a steady DC operating point. Startup waveforms, cable losses and complete equipment energy use need their own boundaries.
Article sections
Define where converter power begins and ends
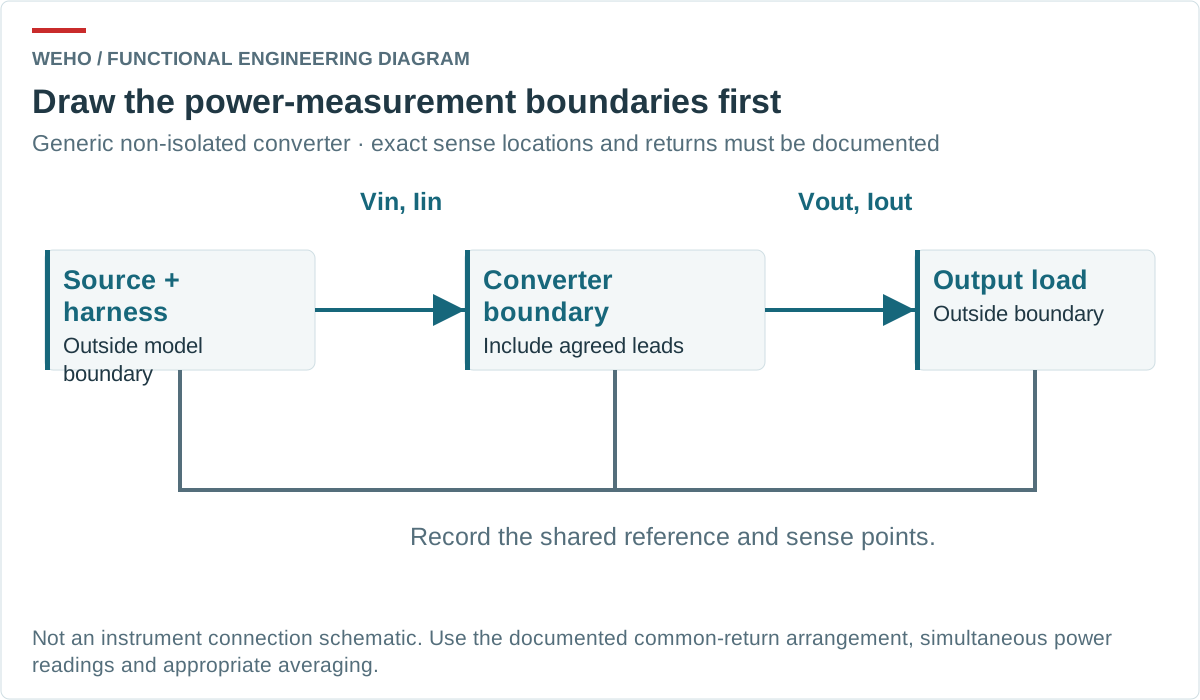
Specify the physical voltage measurement points before connecting instruments. Decide whether a supplied lead is inside the product being evaluated or outside the converter boundary, then apply the same definition to every sample. On a three-wire non-isolated converter, record the exact common-negative lead termination, both positive sensing points and all current paths at the shared return junction. The shared-return topology matters to the measurement as well as to the equipment interface.
For a sufficiently steady DC input and output, Pin = Vin × Iin, Pout = Vout × Iout, efficiency is Pout ÷ Pin, and loss is Pin − Pout. Use volts, amperes and watts consistently.
If voltage and current change materially during the measurement window, average their instantaneous product or use a suitable power-measurement method. Multiplying two separately averaged, unsynchronized readings need not give the correct average power. The TI efficiency-measurement demonstration explains why accurate input and output measurements matter.
Recalculate one hypothetical operating point
Assume the following steady readings at a declared converter boundary after its temperature has stabilized. They are a hypothetical measurement example, not a WEHO test or a model efficiency curve.
| Quantity | Assumed reading or calculation | Meaning |
|---|---|---|
| DC input | 24.00 V × 2.10 A = 50.40 W | Power entering the defined converter boundary |
| DC output | 12.00 V × 4.00 A = 48.00 W | Power leaving that boundary |
| क्षमता | 48.00 ÷ 50.40 × 100 = 95.24% | Ratio at this operating point only |
| Power loss | 50.40 − 48.00 = 2.40 W | Difference to account for within this boundary |
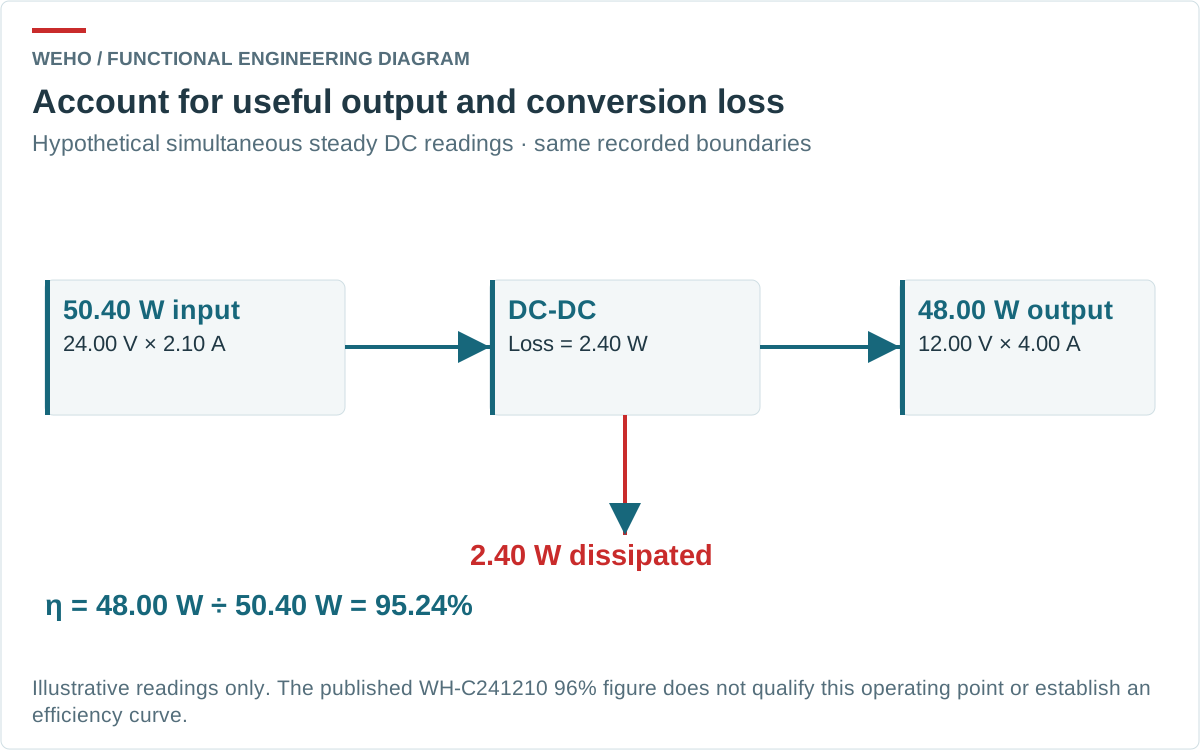
The input current is 2.10 A, not the 4.00 A output current: a step-down converter trades voltage and current while losing some power. The 2.40 W loss is an initial thermal-budget input, not a predicted enclosure or component temperature. Converting it into temperature requires the actual heat-transfer path and operating conditions.
A boundary or measurement error of 0.20 W would equal 8.3% of this calculated 2.40 W loss. That is why a small apparent difference between samples deserves an uncertainty check before being described as a product advantage.
Keep the instruments and lead losses consistent
Measure terminal voltage independently of the source’s front-panel setting. Input cable resistance and an ammeter’s burden can lower the voltage reaching the unit. Similarly, an electronic load’s reported power may be measured after output cable loss. Neither reading automatically matches the converter boundary.
Where the equipment permits it, separate voltage sensing from current-carrying leads and document the sensing locations. Separate probes do not eliminate resistance already inside a shared lead. Moving a common reference point can move the resulting voltage drop between the input/output readings or change which lead loss is counted. Keep the physical terminations consistent; do not infer inaccessible internal terminal voltages from an unverified lead-resistance value.
Specify acquisition bandwidth, integration time, shunts and local decoupling as part of the test setup. Hold that configuration constant between samples. Filtering and averaging must not hide material voltage/current ripple or replace the required average instantaneous-power calculation. Changing meter ranges at light load can also change measurement burden; repeat a suspect point with the setup documented.
Record instrument accuracy and the uncertainty of input and output power. The loss is their difference, so a seemingly precise percentage can conceal a large relative uncertainty in a small loss. Stop short of declaring an efficiency improvement when the difference cannot be distinguished from the measurement uncertainty.
Use matching acquisition windows for input and output. If the equipment changes state during a reading, retain that event in the record and repeat a defined steady-state point. An average from one state should not be divided by an input reading from another.
Ask for an operating matrix, not one attractive percentage
Choose input and load points from the actual equipment requirement, within the applicable model limits. Include the usual operating load and relevant extremes. Record ambient conditions, mounting, airflow and stabilized temperatures alongside output voltage and power. A repeatable temperature-stability criterion belongs in the agreed procedure.
TI’s discussion of switching and conduction losses shows why losses can change with operating conditions. Do not extrapolate a single percentage into a complete curve. The same nominal output power can produce a different loss at another input voltage or control mode.
Keep no-load input power separate. With zero useful output power, a loaded-efficiency percentage does not explain standby demand. If duty-cycle energy is the actual decision, measure each defined equipment state and its duration rather than apply the full-load percentage to every state.
Review WH-C241210 evidence within its stated scope
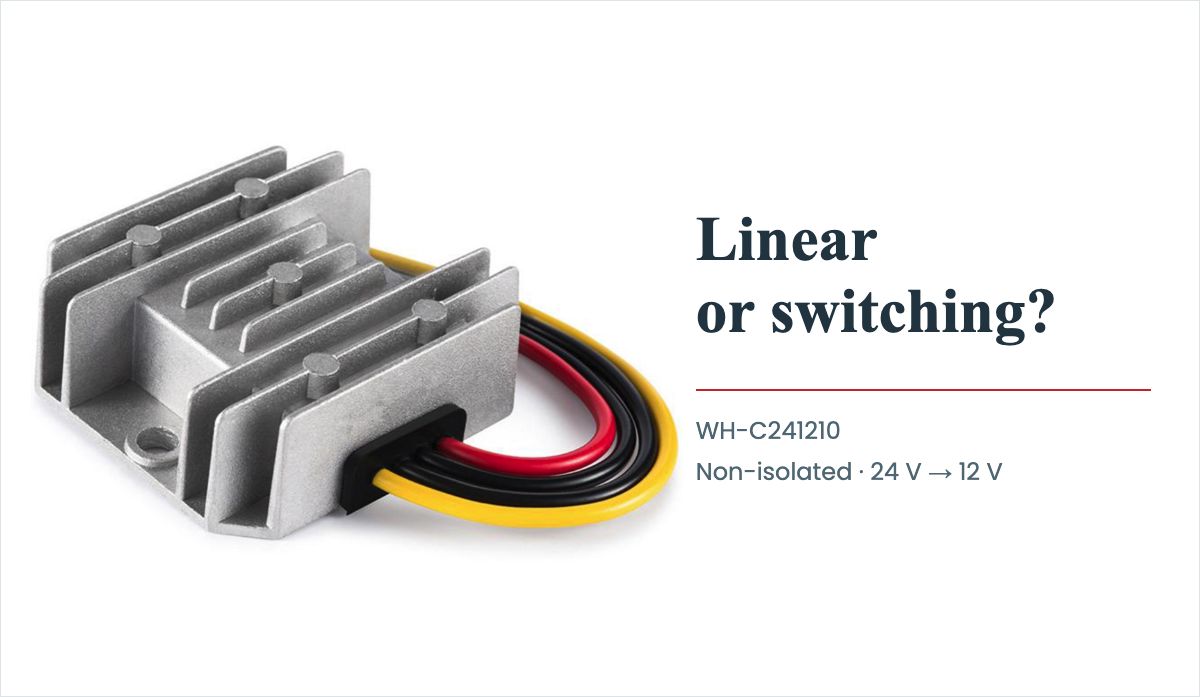
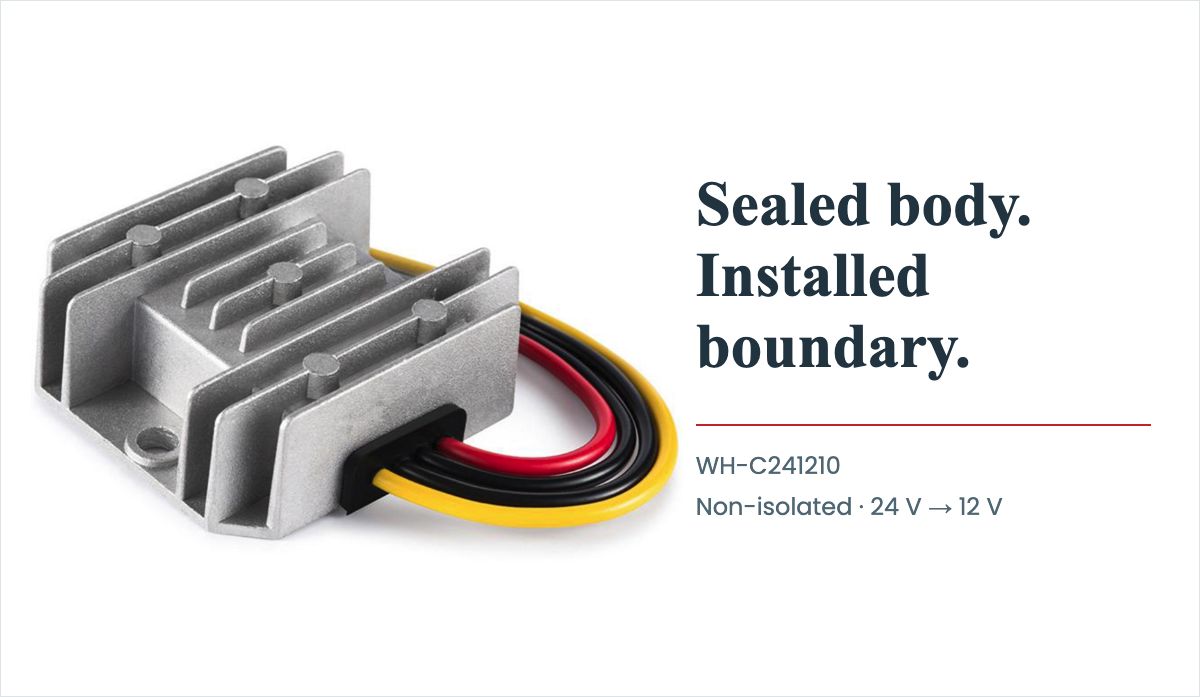
The WEHO WH-C241210 product details describe a non-isolated 24 V to 12 V step-down converter with a published 18–32 V input range and 10 A, 120 W output rating. The WH-C241210 specification PDF lists 96% efficiency.
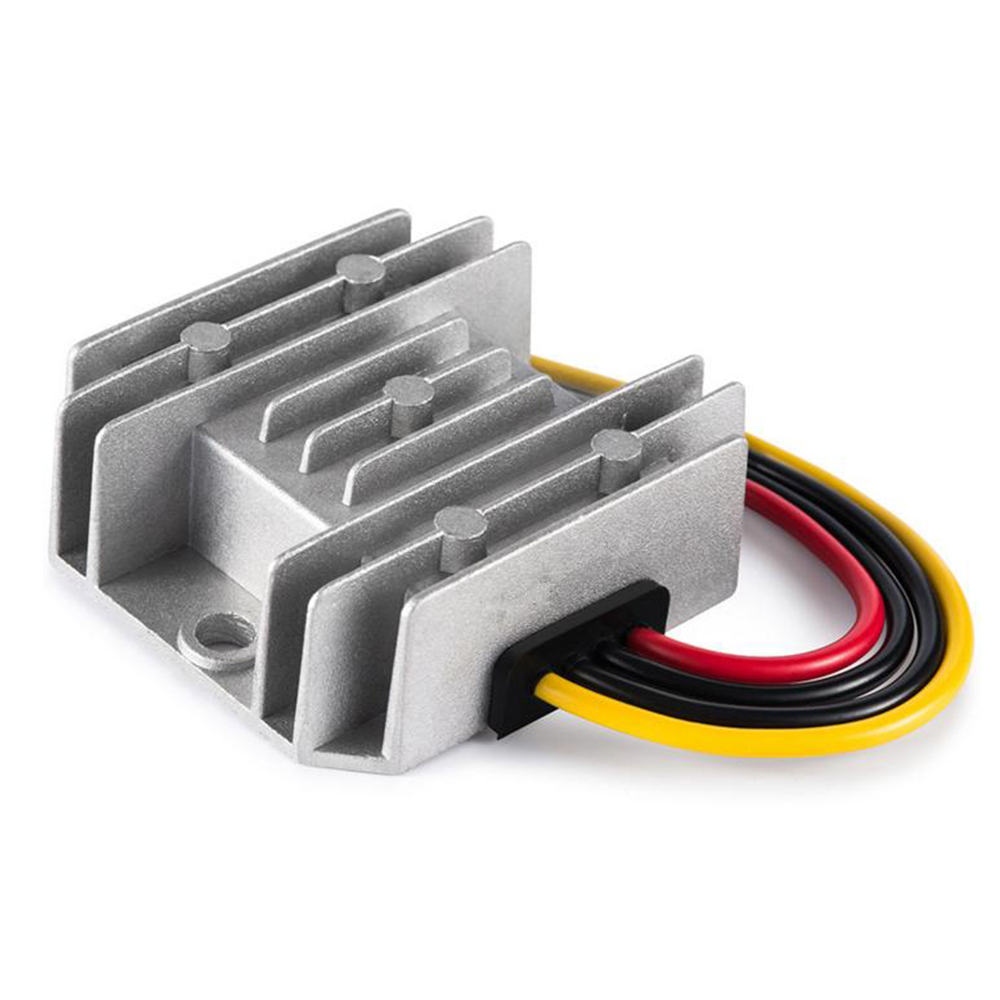
The reviewed public documents do not provide an efficiency-versus-load/input/temperature curve or sufficiently complete conditions for treating 96% as a guaranteed value across the range. It must not be assigned to the hypothetical 48 W example. Ask whether the figure is typical, a peak at one point, or a specified minimum, and request the exact input voltage, load current, stabilized thermal state and lead-sense locations. Obtain the applicable controlled revision before using it as an acceptance limit.
The 45 °C row describes rated temperature rise. It is not an ambient-temperature limit, a permitted enclosure temperature or a derating curve. Product appearance cannot supply those missing thermal conditions. Likewise, a published no-load bound is a separate datum, not a measured point on a full efficiency curve.
Send the operating point with the efficiency question
Send WEHO your converter efficiency and loss-review requirements, including:
- Input-voltage envelope and the steady/varying loads to be compared.
- Lead-end, common-return and voltage-sense locations defining input/output power.
- Acquisition window, bandwidth, decoupling, instrument uncertainty and stabilization criterion.
- Mounting, environment, sample/document identity, and whether a quoted efficiency is typical or a specified minimum.
Ask for a table with input/output voltage and current, calculated power, temperature state and document or sample identity. If a converter feeds a USB source-interface assembly, keep this DC measurement record separate from port-behavior verification. The record gives engineering and procurement a common basis for comparison before an equipment thermal assessment.