

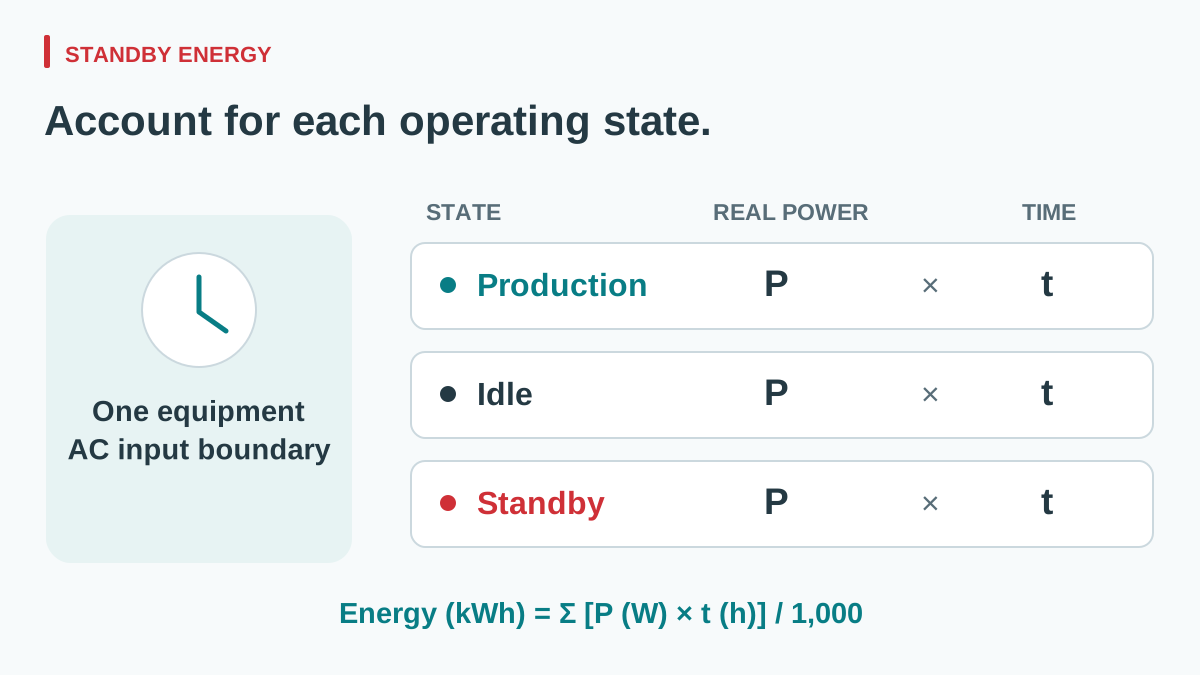
Calculate standby power consumption at the equipment boundary you intend to improve. A machine waiting for a command may still power a controller, communications, indicators, and auxiliary converters. Its AC input consumption is different from the no-load input power of the disconnected power supply. For OEM comparison, define each operating state, measure real input power, and multiply it by the time the equipment actually spends there.
The resulting state-based energy budget helps engineering and procurement compare useful changes. A lower standby figure matters in proportion to its duration; it does not automatically create the same percentage reduction in annual equipment energy.
Article sections
Define the state and the measurement boundary
Use operational descriptions that another engineer can reproduce. “Standby” might mean waiting for a network command with the process hardware disabled. “Idle ready” might retain more subsystems so production resumes quickly. State those functions explicitly. The names here describe an OEM project, not a legal classification applied to every machine.
| Quantity | Boundary and condition | What it answers |
|---|---|---|
| Equipment active input power | AC inlet of the defined equipment during a representative task. | What does the operating task consume? |
| Equipment idle or standby input power | Same AC inlet, with a documented set of functions retained. | What does the machine consume while waiting? |
| PSU no-load input power | AC input of one specified power supply, with its external output load disconnected under stated conditions. | What does that source draw without the connected equipment load? |
| Rated DC output power | Source output capability under documented conditions. | How much load can the source support, rather than what it continuously draws? |
View full diagram ↗
Also identify separate feeds. A cabinet may receive power through its main inlet while an external network or backup source energizes another interface. Document those contributions rather than declaring the whole machine “off” because one inlet reads zero.
Use watts for the energy budget, not volt-amperes
Real input power is measured in watts. Apparent power, in VA, is RMS voltage multiplied by RMS current. Power factor is the ratio of real to apparent power. Keysight’s instrument documentation lists W, VA, and power factor as distinct readings. A current measurement and the mains voltage alone do not establish real consumption.
For example, assume a low-power state has 230 V RMS, 0.020 A RMS, and a measured true input power of 1.20 W. Apparent power is 230 × 0.020 = 4.60 VA; power factor is 1.20 ÷ 4.60 ≈ 0.261. Use 1.20 W in the energy calculation. Treating 4.60 VA as 4.60 W would overstate consumption.
Efficiency addresses another relationship: DC output power divided by real AC input power. It is useful at a defined loaded operating point. At zero delivered output, a percentage efficiency does not help rank the remaining input loss. The WEHO guide to efficiency, power factor, and input current explains the separation. Keep the no-load watt figure alongside the loaded efficiency data.
Build a daily energy budget from real operating time
Consider a hypothetical control subsystem whose entire defined AC boundary averages 80 W during production, 12 W while idle ready, and 1.2 W in standby. Assume eight, two, and fourteen hours in those states every day. These are project assumptions, not measured WEHO product performance.
| State | Assumed real AC input | Hours per day | Daily energy |
|---|---|---|---|
| Production | 80 W | 8 h | 80 × 8 = 640 Wh |
| Idle ready | 12 W | 2 h | 12 × 2 = 24 Wh |
| Standby | 1.2 W | 14 h | 1.2 × 14 = 16.8 Wh |
| Total | State-dependent | 24 h | 680.8 Wh = 0.6808 kWh |
Use E = Σ(Pstate × tstate). With this exact schedule repeated for an assumed 365 days, annual energy is 0.6808 × 365 = 248.492 kWh per subsystem. Real projects need a separate schedule for weekends, shutdown days, and seasonal operation.
Now suppose a verified design change reduces standby input from 1.2 W to 0.6 W while preserving the required functions. The hypothetical saving is (1.2 − 0.6) × 14 = 8.4 Wh/day, or 3.066 kWh/year on the same schedule. Standby power falls by 50%, but total daily energy falls by approximately 1.23%. Keep both percentages attached to their proper denominators.
Include transition energy if repeated wakeups materially affect the total. An event already captured in a state’s measured average must not be added again. The sum of state durations also needs to match the observation period; overlapping state labels create double counting.
Measure low input power with an appropriate method
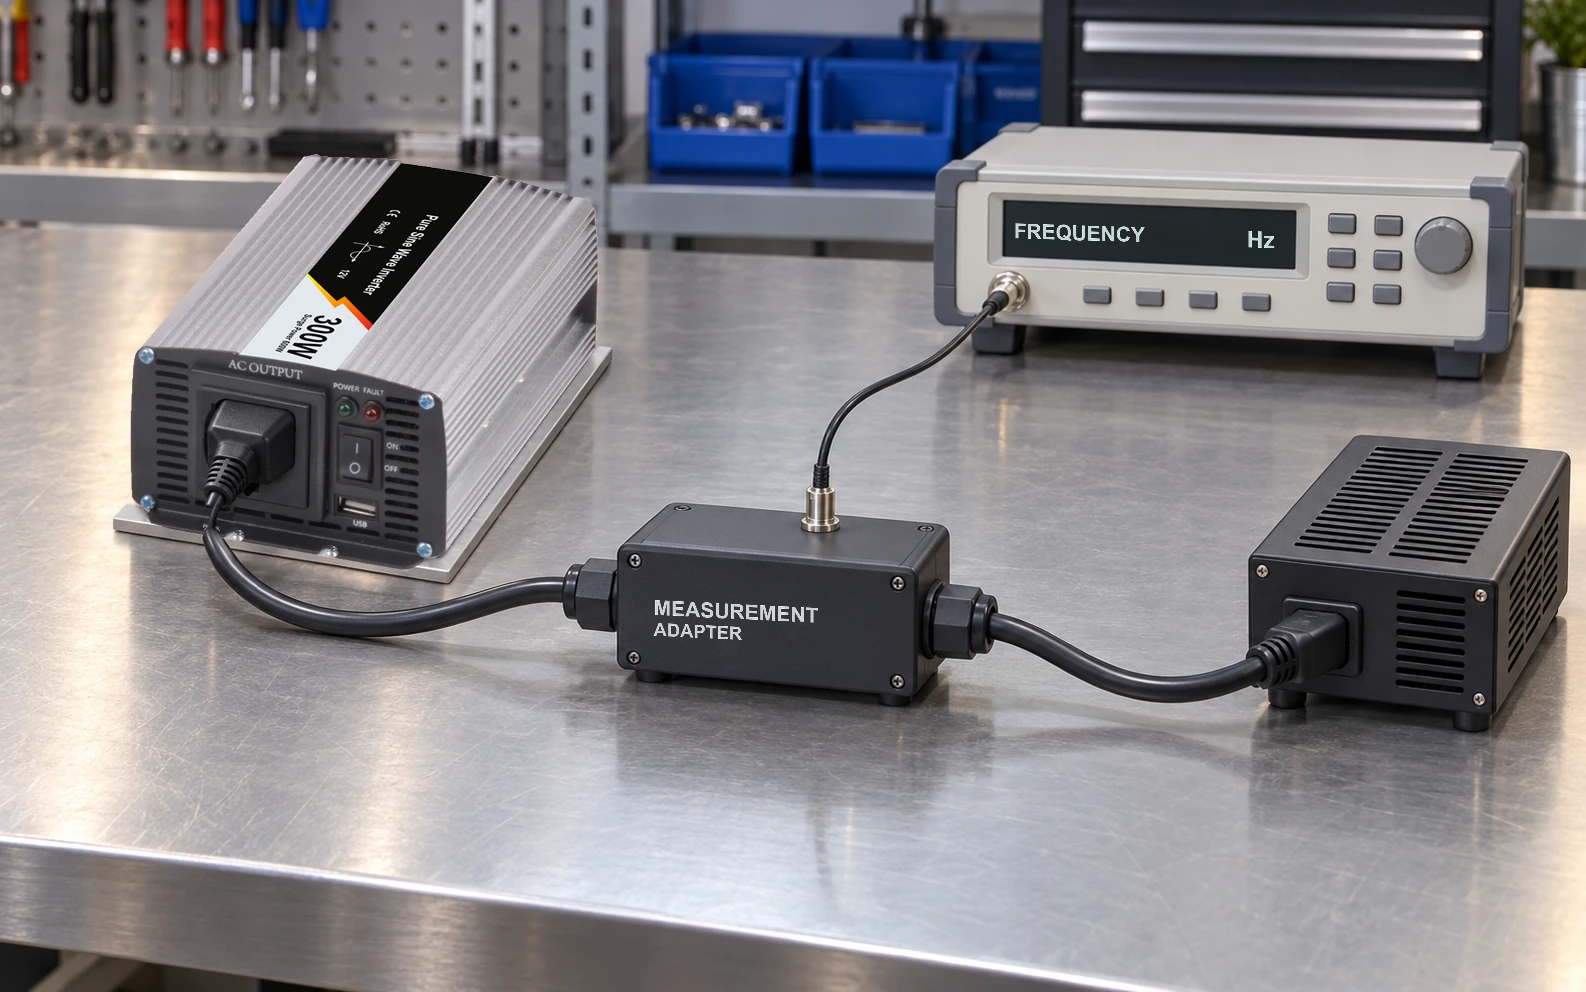
Select an instrument whose uncertainty, resolution, current range, and peak-current capability suit the state being measured. Preserve the input voltage, frequency, equipment configuration, ambient condition, and averaging interval. One stable-looking display value is weak evidence when the equipment periodically polls, communicates, or wakes.
The U.S. Department of Energy’s measurement summary explains averaging fluctuating consumption by measuring energy over an interval and dividing by elapsed time. For an OEM engineering study, choose an interval that captures the actual recurring behavior. That reference is measurement background, not a declaration that a particular appliance test or purchasing rule applies to your equipment.
TI application report SLUA865B, section 6, also discusses energy integration for burst-mode measurements and the effect of instrument loading on small results. Apply the appropriate analyzer instructions to the actual circuit. Do not transfer a reference board’s milliwatt result or connection details to an unrelated assembled supply.
Define comparable measurements for LRS-350-24
For equipment considering the WEHO LRS-350-24 enclosed power supply, the LRS-350 public specification lists a 24 V, 0–14.6 A output version and selectable 90–132 / 180–264 V AC input ranges. Record the exact sample revision, input selector position, AC conditions, temperature, warm-up and any internal fan state. Source-alone measurements include the supply’s own auxiliary consumption; keep fitted auxiliaries in the configuration used by the equipment. Rated output and loaded efficiency cannot replace a measured no-load or standby input-power value.
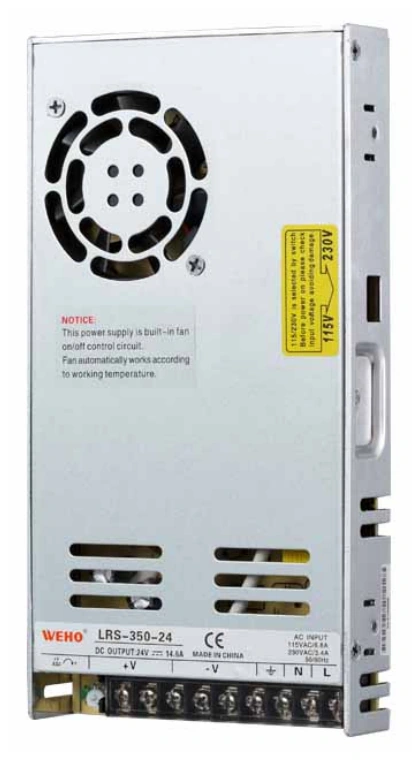
LRS-350-24 measurement candidate; no standby or no-load value is asserted.
View original photograph ↗
Request two distinct records: the source alone with its external output load disconnected, and the connected equipment in each retained-function state. Supply a state list showing controller and communication loads, accessories, wake-up interval, required restart time, and daily duration. Keep AC conditions and measurement boundaries comparable, and retain the instrument details, averaging interval, and uncertainty with each result. Neither the hypothetical 1.2 W nor the 0.6 W figure above is a measured result for LRS-350-24.
Keep component loss and equipment consumption separate in purchasing
A supplier’s source-only no-load measurement can support component comparison, but it cannot predict a connected machine’s standby consumption. Reconnecting the controller changes the loading and possibly the source’s operating mode. Subtracting the disconnected no-load figure from the complete machine reading does not reliably reveal the controller’s DC power.
Keep loaded-efficiency operating points separate from the no-load and retained-function records. A proposed improvement must preserve the equipment’s required waiting-state functions and restart behavior.
Use the OEM power-supply RFQ checklist to carry the agreed conditions into sample review. Preserve the state definitions with the configuration record so a firmware change or an always-on accessory does not silently change the basis of comparison.
Ask WEHO for model-specific no-load and operating-point information. Send the identified LRS-350-24 configuration and the state schedule and measurement records above. Evaluate any proposed saving against the complete equipment energy budget.