

Key Engineering Takeaways
- Size a pulsed lighting system against its peak electrical demand and documented operating limits, not average watts alone.
- XLG-60-24 is listed at 24 V, 2.5 A and 60 W; those entries do not establish permission to exceed the rating during a pulse.
- Include controller demand and the combined timing of all channels sharing the source.
- Treat the worked pulse schedule as a hypothetical screening example, not a tested WEHO strobe application.
Why can a low average load exceed the source requirement?
A lighting channel can draw a high current for a short interval while consuming relatively little energy over a longer cycle. The source still encounters the instantaneous electrical demand. For an OEM machine-vision designer, an energy calculation and a source-capability decision therefore answer different questions.
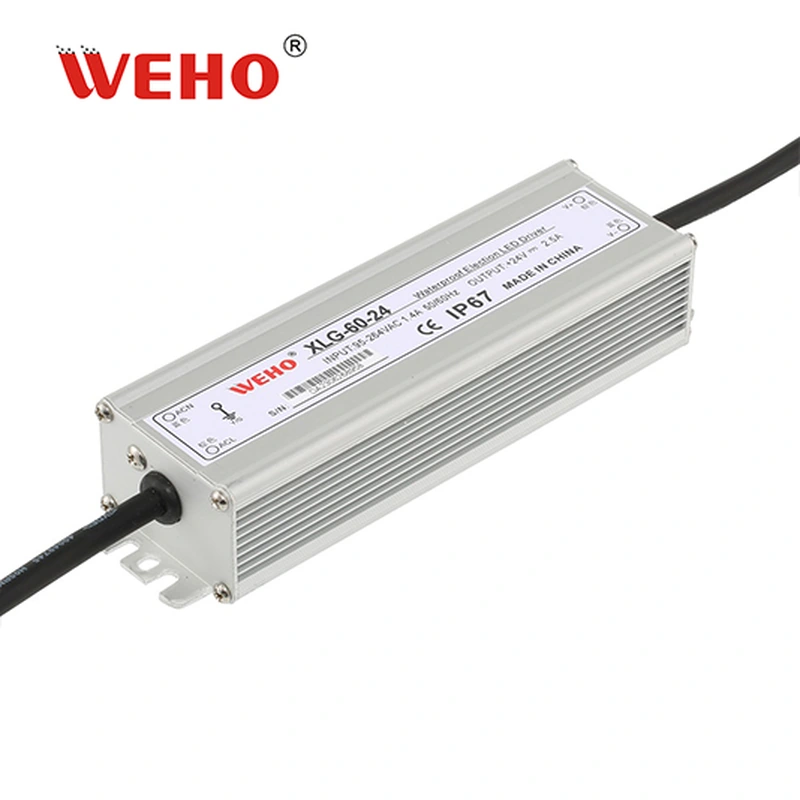
The XLG-60-24 supply product information identifies a 24 V, 2.5 A, 60 W variant. This article uses that documented reference to show what an initial screen can establish. It does not claim that the driver provides a strobe input, a particular pulse-overload capability or compatibility with an unspecified light controller.
Which quantities belong in a pulsed-load record?
Record on-state current, off-state current, pulse duration and repetition period for each electrical load. For a constant-voltage calculation, include the relevant supply voltage and the controller’s own demand. A timing label such as “20% duty” is incomplete without the current levels and time scale.
For an ideal rectangular schedule, duty ratio D equals on-time divided by repetition period. Average current is Iavg = Ion × D + Ioff × (1 − D). This equation describes the stated waveform; it does not include startup, edge transients or undocumented behavior.
Pulse duration matters independently of duty ratio. Two loads can have the same average current while one produces short frequent events and another produces a long sustained demand. The source’s applicable dynamic limits and protection behavior must cover the actual event, including its repetition and recovery conditions.
Distinguish the source port from the LED port when a controller or energy-storage stage sits between them. A controller may change what the source sees, but its effect must be supported by its documented input requirements and measurements. An LED-side pulse current cannot simply be renamed as source current, or assumed to disappear behind a controller.
What does the complete peak-versus-average example show?
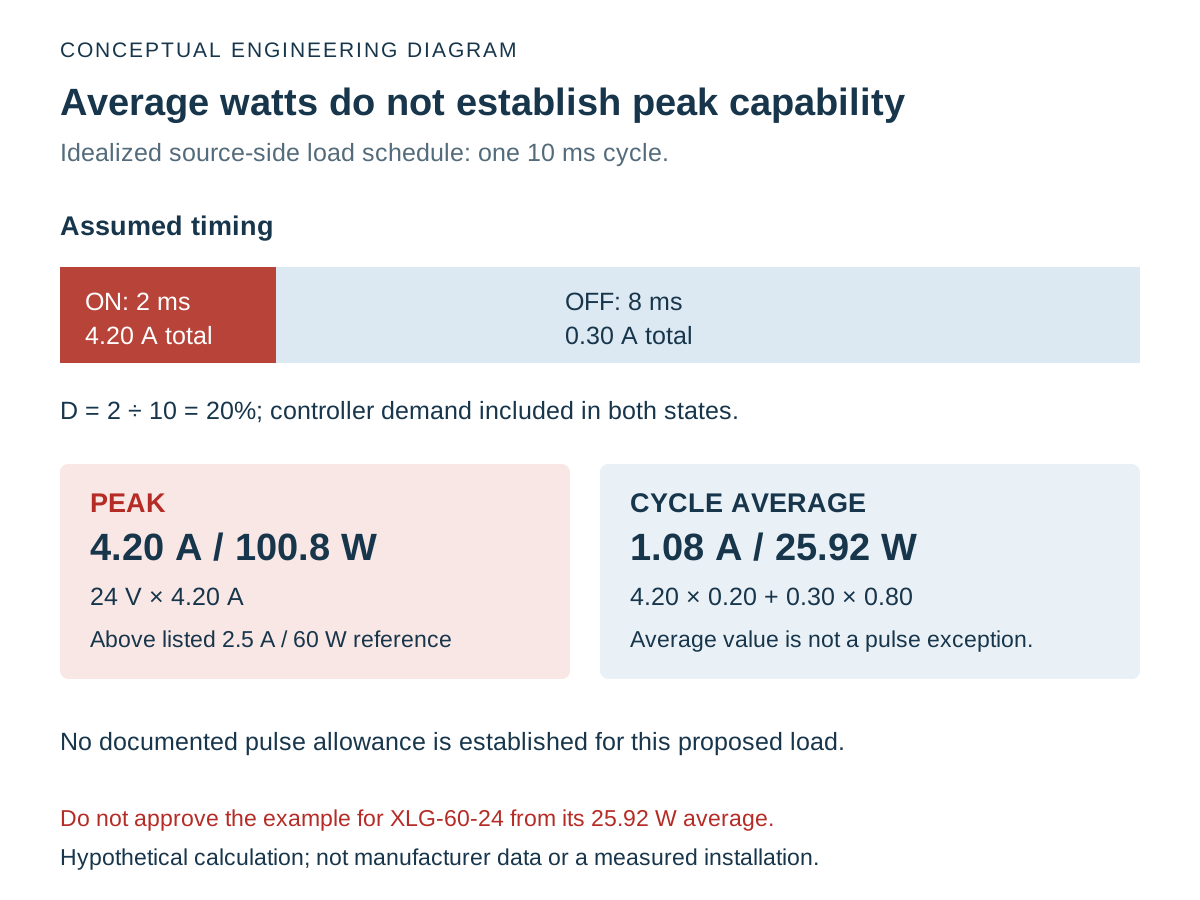
A complete example compares the entire simultaneous source demand with the documented source limits, then keeps dynamic qualification open. The following Hypothetical Pulsed-Load Example assumes a 24 V branch with a rectangular current schedule; it contains no measured WEHO waveform or customer installation.
Assume that the lighting channel draws 4.0 A when on and 0.1 A when off. It is on for 2 ms in every 10 ms period. A separate controller draws a constant assumed 0.2 A from the same 24 V source.
| Quantity | Calculation | Result | Meaning |
|---|---|---|---|
| Duty ratio | 2 ms ÷ 10 ms | 0.20 = 20% | Assumed rectangular schedule |
| Lighting average current | 4.0 × 0.20 + 0.1 × 0.80 | 0.88 A | Cycle average, excluding controller |
| Total average current | 0.88 + 0.20 | 1.08 A | Assumed source-side average |
| Average output power | 24 V × 1.08 A | 25.92 W | Average DC output, not AC input energy |
| Simultaneous peak current | 4.0 + 0.20 | 4.20 A | Demand during the on interval |
| Peak output power | 24 V × 4.20 A | 100.8 W | Above the listed 60 W reference |
The 25.92 W average does not approve this load for XLG-60-24. The assumed 4.20 A peak is above the listed 2.5 A rating, and the corresponding 100.8 W is above 60 W. The available product entries do not establish an applicable pulse exception, so this proposed combination cannot be approved from these calculations.
Consider a second hypothetical channel drawing 2.0 A when on, with the same 0.1 A off current, timing and 0.2 A controller. Its average is 0.68 A, or 16.32 W at 24 V. Its peak is 2.20 A, or 52.8 W. This passes only the simple nominal current-and-power comparison; it still needs the actual operating-condition and dynamic checks.
Neither result establishes light-output quality. Optical intensity, camera exposure, LED pulse limits and inspection acceptance belong to the lighting and vision system’s own evidence. Electrical headroom cannot substitute for that assessment.
Swipe horizontally on a small screen, or open the full-size diagram.
How do multiple lighting channels change the result?
Add simultaneous currents at the shared source rather than multiplying a single-channel average by an assumed channel count. Preserve the actual timing relationships and include operating modes that can change them, such as manual lighting, fault handling or a production recipe change.
Two channels assumed to run at separate times may overlap when a trigger is retried or a machine is placed in setup mode. That is a requirement to define and verify, not a reason to invent a universal overlap allowance. Record credible combinations with the controller supplier and equipment team.
| Operating case | What the record must show | Evidence for the decision |
|---|---|---|
| One channel triggered | Source-port current waveform, duration and repetition | Controller requirements and representative measurements |
| Channels overlap | Combined demand including controller consumption | Defined timing limits and overlap test |
| Manual or setup lighting | Any longer on-time or continuous operating mode | Actual machine-mode behavior and applicable ratings |
| Startup or recovery | Charging, restart and readiness conditions | Exact source/controller documentation and system verification |
A source selected for the production pulse schedule may face a different demand in manual mode. Keep that mode in the load requirement even when operators seldom use it. If the system prevents a combination, document and verify the actual control behavior instead of relying on an informal operating expectation.
What should the OEM verify before releasing the source?
Verify the defined source-side load profile against the exact supply and controller documents, then test the relevant operating modes. The XLG-60-24 documented rating reference is an initial boundary; it is not a dynamic application approval.
- Identify both interfaces. Record the supply model, controller model, light engine and the circuit between them. Establish whether the lights require regulated voltage or controlled current, and confirm the intended connection with the component suppliers.
- Collect the complete schedule. Record on/off levels, durations, repetition, channel overlap and nonproduction modes. Mark assumed values separately from measured values and manufacturer limits.
- Check continuous and dynamic requirements. Compare current and power under the relevant input, ambient and mounting conditions. Obtain any applicable transient capability with its duration and conditions; do not infer one from an overload-protection percentage.
- Measure the relevant source port. Use a suitable qualified test method and instrument setup to capture voltage and current through startup, pulses and recovery. Define limits before testing; a single slow display reading is not a complete waveform record.
- Retain the operating matrix. Associate results with the actual hardware, firmware, wiring and recipe versions. Recheck affected cases after timing or lighting changes, instead of carrying an old approval into a different load profile.
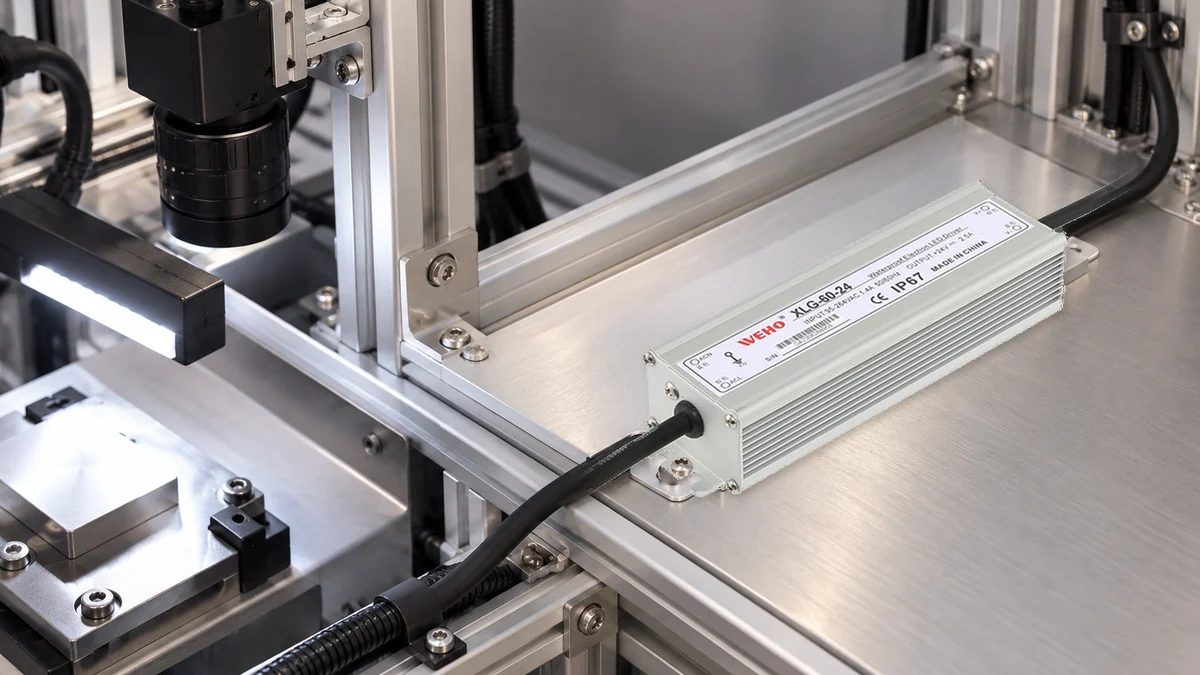
The mechanical scene shows an illustrative supply position beside a vision-lighting fixture, not the waveform in the example or a tested WEHO strobe system. Exposure, banding and image-quality qualification remain separate system-level tasks even when the electrical load profile is acceptable.
What should accompany a pulsed-load enquiry?
Send WEHO the source-side load profile with the exact supply candidate, controller, light interface, input and ambient conditions. Include peak current, pulse width, repetition, credible overlap and continuous modes. Ask for the applicable limits and supporting information rather than requesting approval from average watts alone.
Engineering FAQ
Can I select a 60 W supply for a 100.8 W pulse because the average is 25.92 W?
No. The average calculation does not establish permission for that peak. Approval needs documented capability covering its magnitude, duration, repetition and operating conditions, plus system verification. The example does not establish such capability for XLG-60-24.
Does a current-limit figure establish a pulse-overload rating?
No. Protection behavior and a permitted repetitive operating load are different specifications. Obtain the exact product’s applicable dynamic limits and recovery information rather than using a protection percentage as an operating allowance.
Can controller energy storage reduce source-side peak current?
It can change the source-side waveform, but the effect must be established for the actual controller and circuit. Use the controller’s input requirements and measurements; do not transfer LED-side current directly or assume that storage eliminates startup and recharge demand.
Does passing the nominal peak comparison finish qualification?
No. A nominal current-and-power comparison is only one screen. Verify output mode, dynamic response, input and thermal conditions, startup, recovery, wiring and the light system’s own limits for the intended operating matrix.