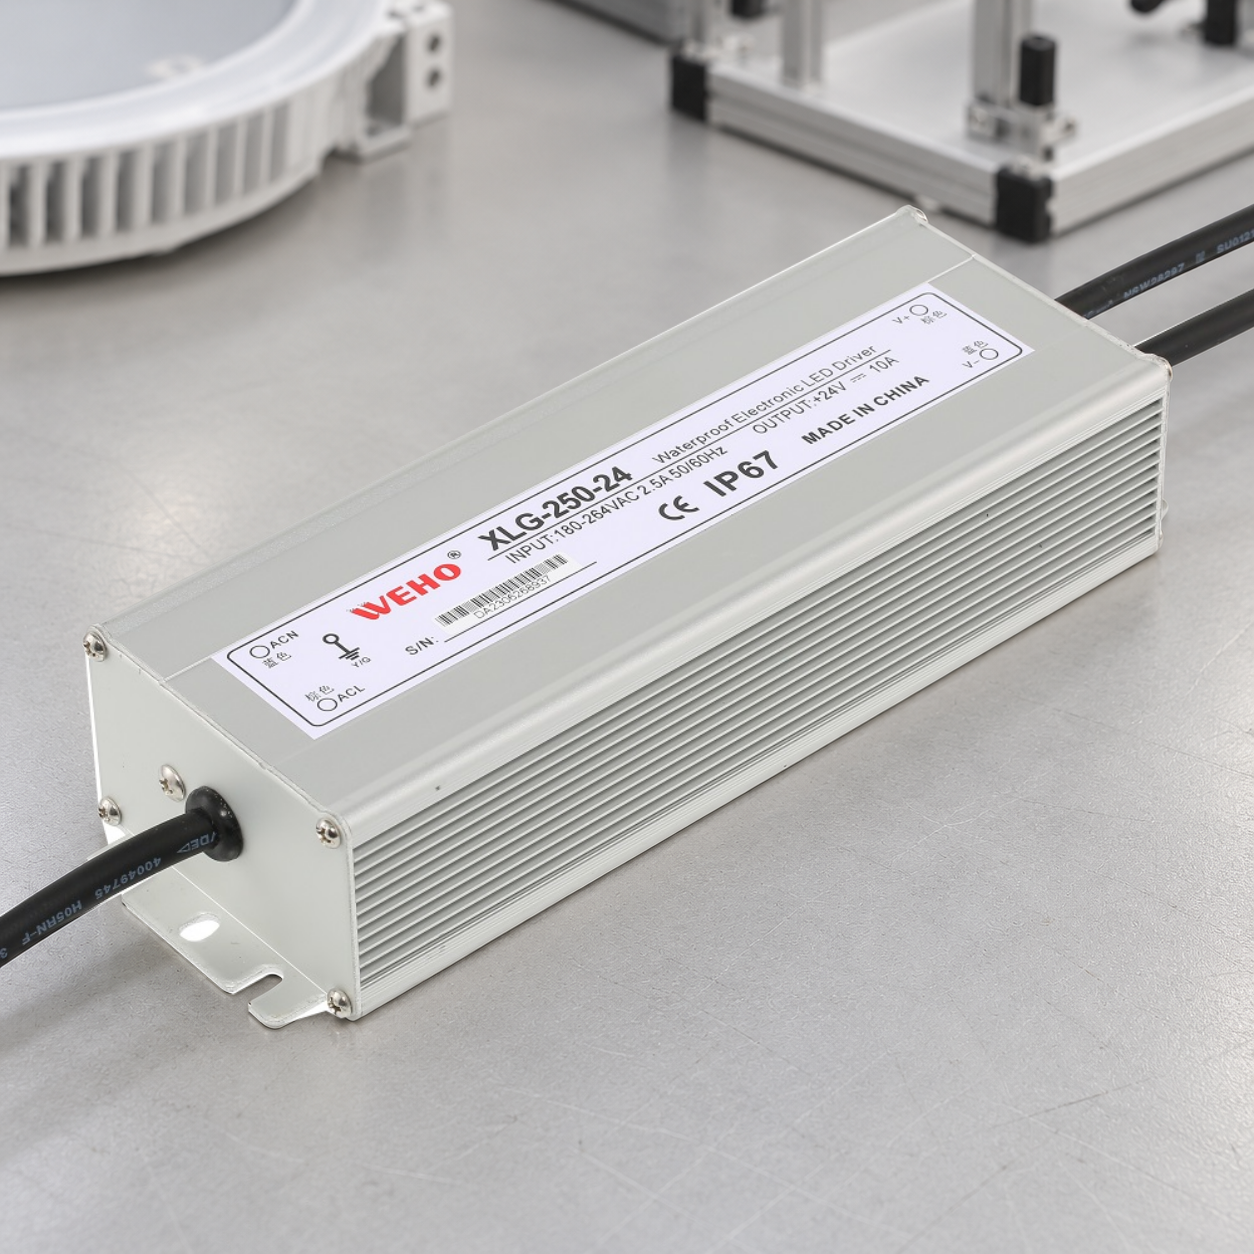


Evaluate LED driver flicker with a defined optical measurement of the complete driver, LED engine and control configuration. A smooth-looking phone video, a nominal PWM frequency or a low electrical ripple reading cannot replace the required light-output test. Release the result together with the operating conditions that produced it.
On this page
For an OEM, the useful deliverable is an acceptance matrix across relevant operating states. It lets engineering compare configurations, purchasing request reproducible evidence and production understand which changes invalidate the qualification. A single favorable full-output result is a limited observation.
Specify the optical question before selecting a metric
The CIE distinguishes temporal light modulation from the perceptual effects it can produce. Its definitions and measurement models discuss temporal light artefacts, while CIE TN 012:2021 provides recommendations for consistent measurement protocols. Choose the measurement method and required metrics for the actual application, market and specification.
In this general-lighting context, PstLM evaluates flicker and SVM evaluates the stroboscopic effect. They are not alternate names for percent modulation. Signify’s EyeComfort technical white paper explains why frequency, waveform and modulation characteristics matter. Do not declare compliance from a marketing phrase such as “flicker-free” without the applicable method and conditions.
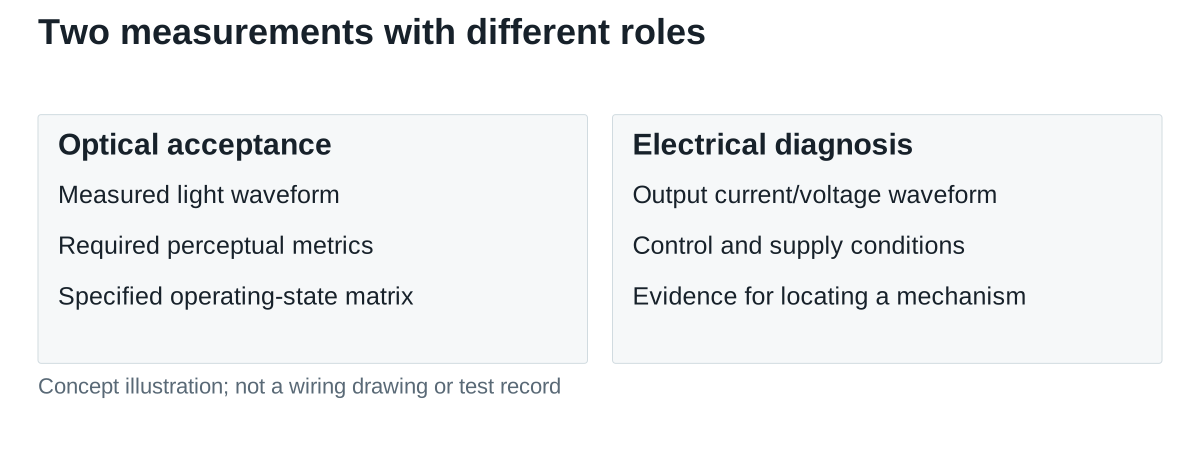
For camera lighting, exposure settings and imaging artifacts need their own application evaluation. Passing a general-lighting metric does not guarantee compatibility with every camera, shutter or scan mode. Keep that additional requirement separate from the optical acceptance matrix described here.
Freeze the measured system and detector setup
Identify the exact driver suffix/revision, LED module, controller and control configuration. Record supply voltage/frequency, load arrangement, temperature or stabilization condition and dimming state. A different controller or output setting, where the identified hardware supports one, can produce a different waveform even if the driver enclosure remains unchanged.
Use an optical detector and measurement chain suitable for the selected method. Retain its spectral response/correction information as applicable, linear range, acquisition settings, calibration status and uncertainty information. Avoid detector saturation and unintended ambient-light contributions. Keep geometry and optical collection conditions reproducible.
Electrical output current or voltage can be captured as diagnostic evidence, using suitable approved measurement methods. It helps locate a modulation mechanism or control issue. It is not automatically the same waveform as the emitted light after the LEDs, thermal behavior and optical system have responded.
Build the operating-state matrix before testing
| Test dimension | Record | Reason for including it |
|---|---|---|
| Input Condición | Applied voltage/frequency and tolerance or selected checkpoints | Compare the same supply condition |
| Output configuration | LED engine, wiring, supported output setting and load | Identify the actual light-producing assembly |
| Dimming state | Command and measured/observed operating state | Expose low-end and control-dependent behavior |
| Thermal state | Defined stabilization condition and relevant temperature | Make repeat tests comparable |
| Measurement | Raw optical waveform, acquisition method, metric/version and result | Allow independent review |
Select checkpoints that represent the specified use: full output, a middle state, the required minimum level and transitions if transitions matter. Determine whether different controller modes or configuration files require separate rows. The project’s test plan defines the coverage; there is no universal driver-count or dimming-point rule.
Hypothetical coverage example: three input checkpoints, four dimming states and two thermal states produce 3 × 4 × 2 = 24 operating combinations for one hardware/configuration set. Adding a second controller mode doubles that to 48. This is test-planning arithmetic, not a mandated sample plan or a record of completed tests.
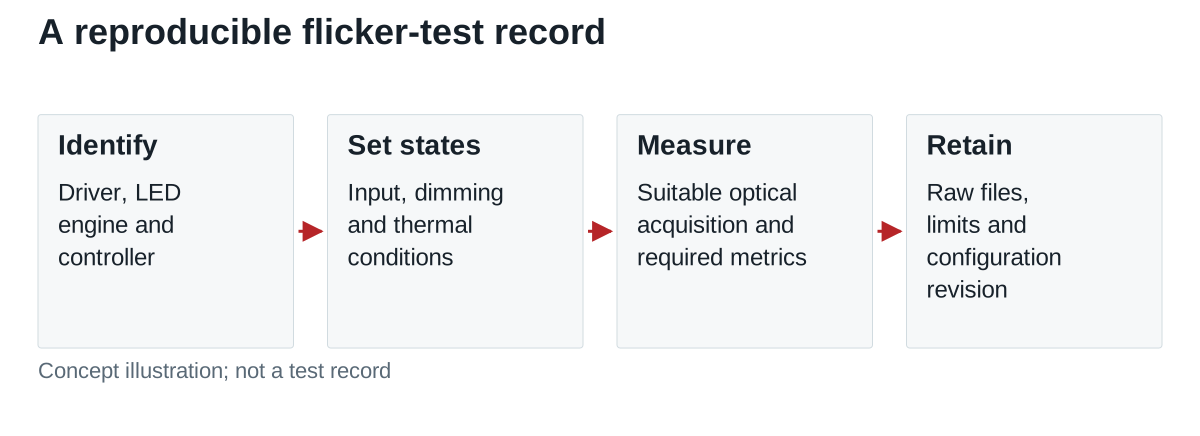
Decide whether every combination requires the full metric acquisition or whether a justified screening sequence selects the worst cases for detailed measurement. Document that rationale before interpreting the results. Do not report a selected subset as though the entire matrix had been tested.
Do not confuse a waveform percentage with a complete result
For a simple illustrative optical waveform with maximum 120 units and minimum 80 units, the conventional percent-modulation calculation is (120 − 80)/(120 + 80) × 100 = 20%. The units cancel in this ratio, provided both readings come from the same suitable linear measurement.
That one number does not preserve the waveform’s frequency, shape or duty cycle, and does not establish PstLM, SVM or an application pass. Two waveforms with the same maximum and minimum can differ in those characteristics. Retain the sampled waveform and calculate the required metrics using the specified method.
Write acceptance limits into the project specification before supplier comparison. Where a regional product rule applies, record its scope, test conditions and current requirements with the compliance reviewer. Avoid promoting a convenient number from an unrelated application into a universal threshold.
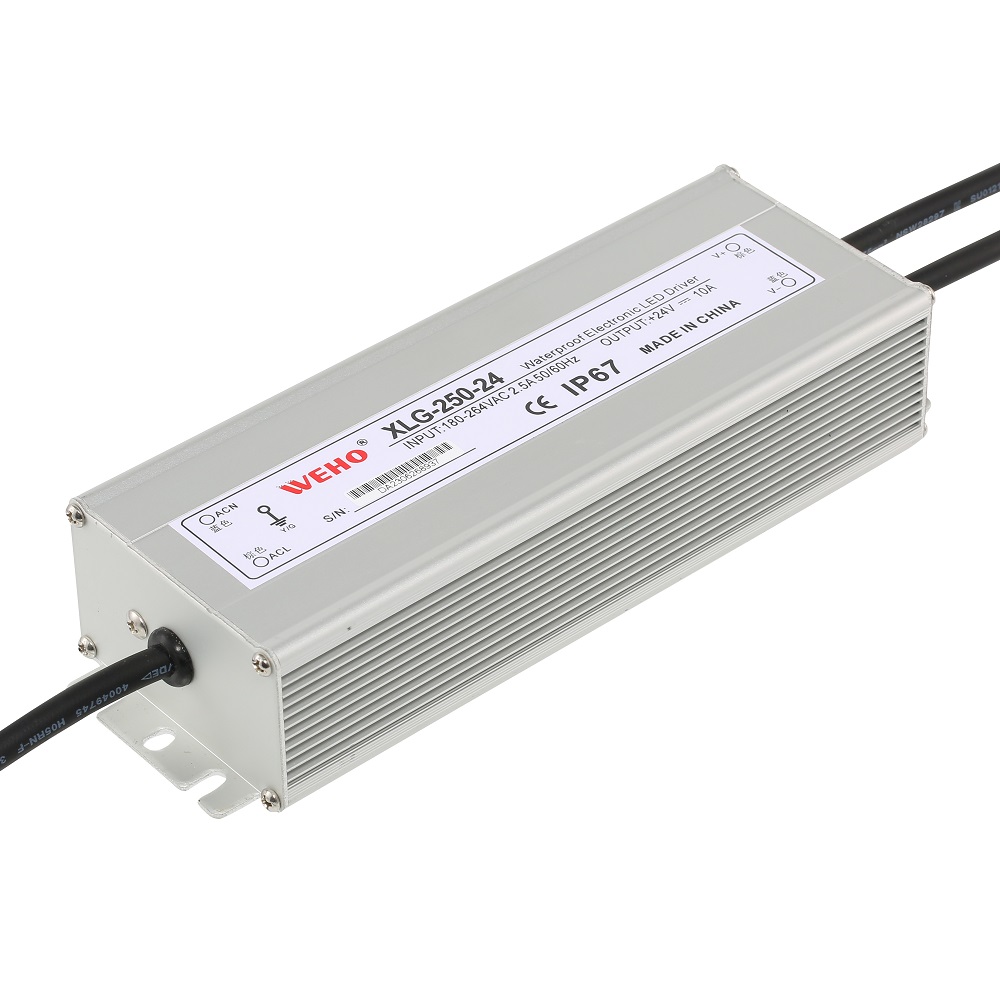
Freeze XLG-250-24 as the intended optical-test DUT
For a test proposal built around the WEHO XLG-250-24, name that exact model, revision and sample identifier in every applicable matrix row. Retain the pictured unit’s label and identify the LED engine and any separately specified controller. A report for another XLG power or voltage variant does not close this DUT’s optical acceptance record.
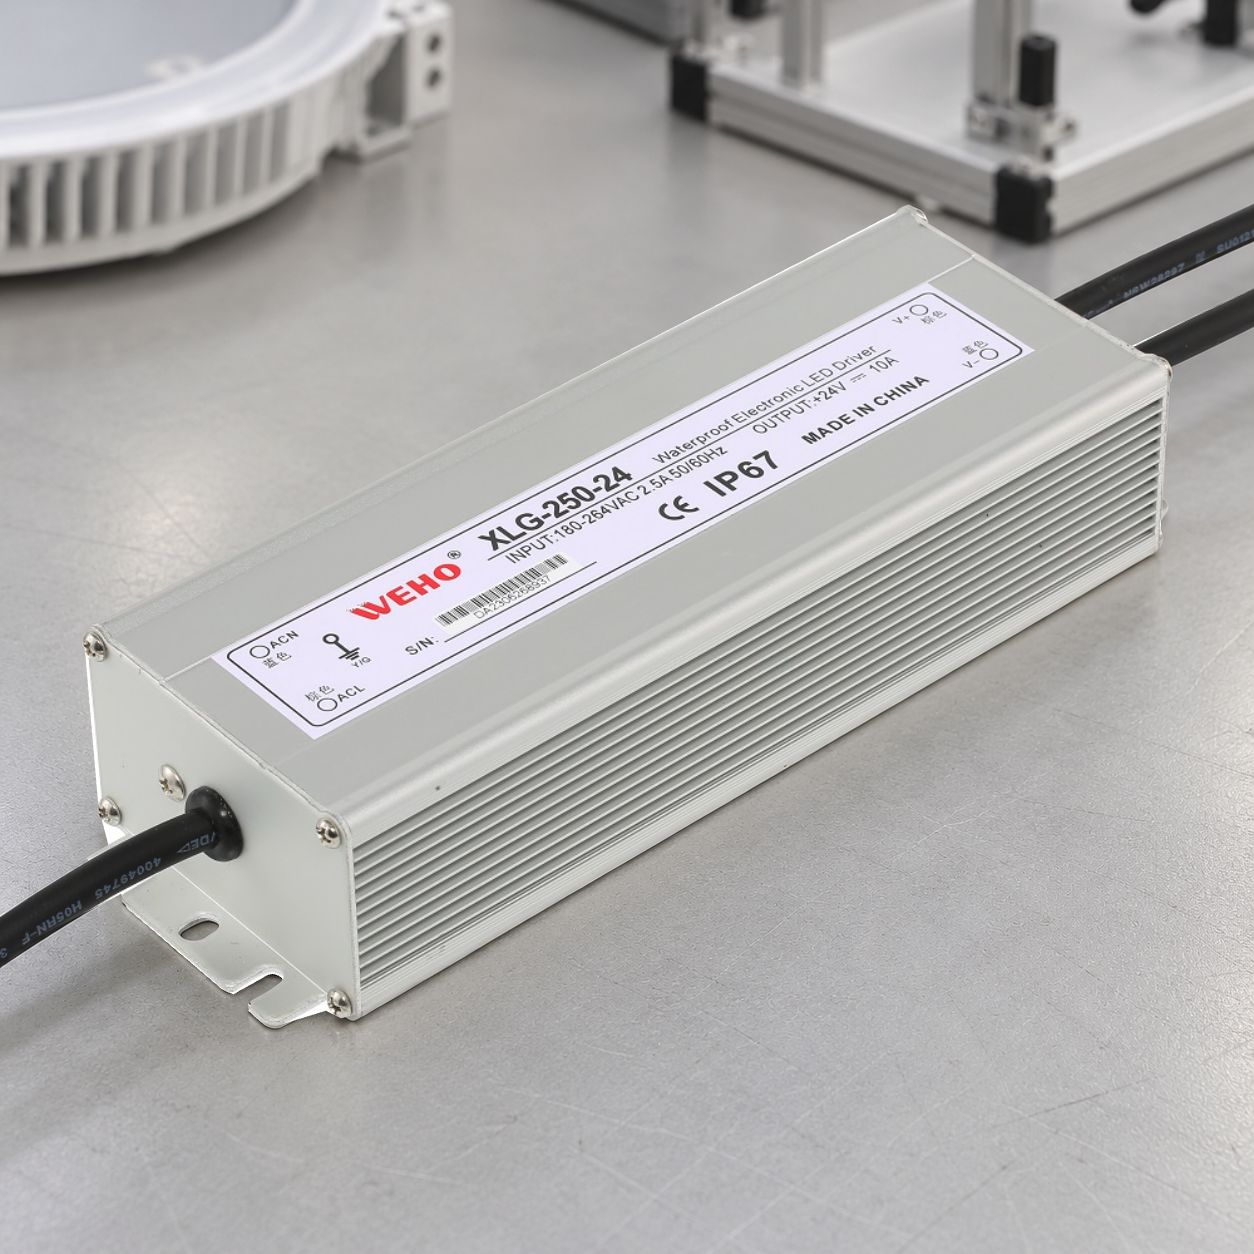
The pictured XLG-250-24 label shows 180–264 VAC input and 24 V, 10 A output. Select the specimen’s input checkpoints within that marked range and confirm the operating limits in the specification applicable to the delivered revision. The photograph supplies no optical result or dimming-interface approval. Confirm the actual 24 V load and any separately identified external controller before applying control-dependent states; a programmed-current setting or integrated dimming function is not established here. If results disagree, compare conditions and raw waveforms first, then change one documented variable at a time. Keep the generic 24/48-combination planning example above separate from completed tests.
Release a reproducible evidence package
Retain the system identities, completed matrix rows, raw optical files, metrics with method/version, instrument details, acceptance criteria and any exclusions. Link the result to the configuration revision and define retest triggers for changes to the LED engine, driver, control method or current setting.
Send WEHO the optical acceptance matrix and the intended LED/control configuration when requesting application evidence. Include the relevant dimming range and whether camera performance is a separate requirement, so the proposed assessment covers the actual release decision.