

A dark area in an LED-lit showcase is not automatically a power-supply fault. Compare an agreed illuminance map with voltage and operating-state evidence before changing the source. Lamp spacing, direction, diffusers, shelves, reflections and the receiving surface can change the lighting pattern even when the electrical feed remains unchanged.
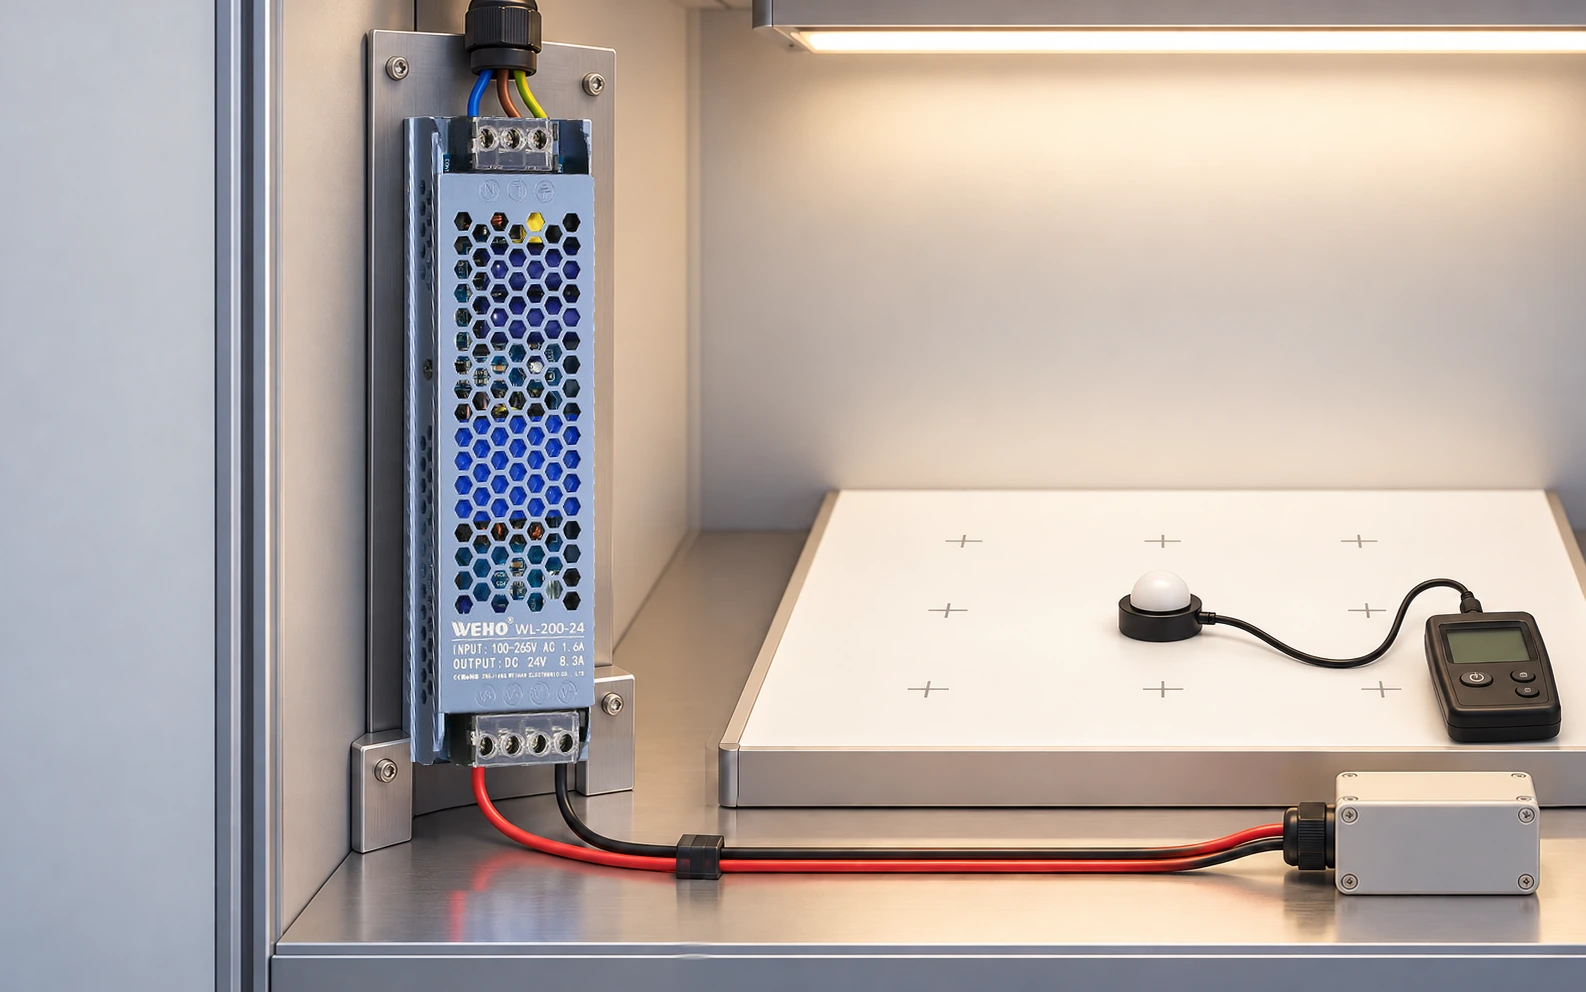
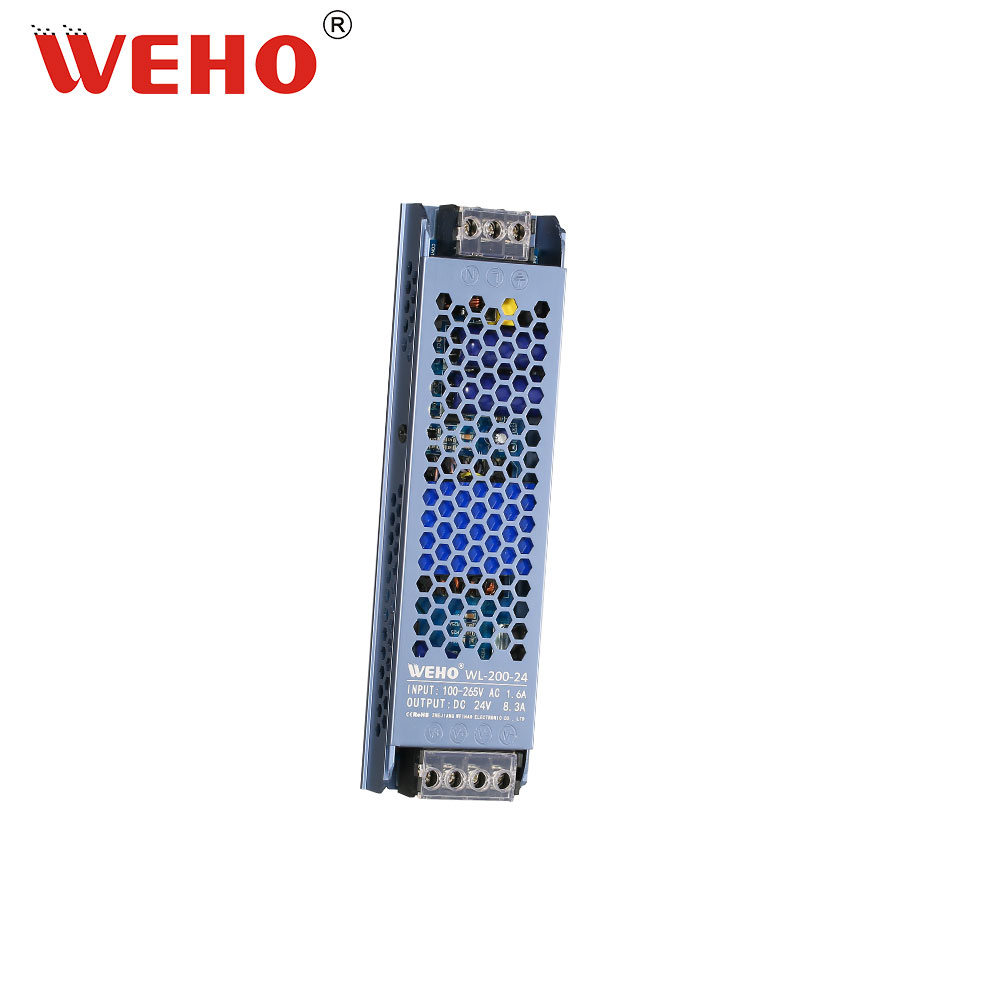
This article helps a retail-fixture OEM agree a repeatable acceptance method. WEHO WL-200-24 is shown as an identifiable 24 V supply example. Its original photo reads 24 V, 8.3 A, while the public table gives different current and power figures. No usable output limit is selected from that disagreement, and the example does not qualify a particular lighting assembly.
Decide what lighting quantity the buyer needs
For light arriving at a shelf or work plane, illuminance in lux is a relevant quantity. For the directional appearance of an illuminated sign or surface, luminance in cd/m² is a different measurement. Konica Minolta explains the distinction between illuminance and luminance. Do not substitute a phone photograph or an unspecified “brightness” number for the agreed quantity.
Name the evaluated plane, its dimensions, normal direction and the product positions it represents. If the task is an illuminated display face rather than a shelf, specify the appropriate luminance method instead. Choosing the quantity first prevents a technically accurate meter reading from answering the wrong purchasing question.
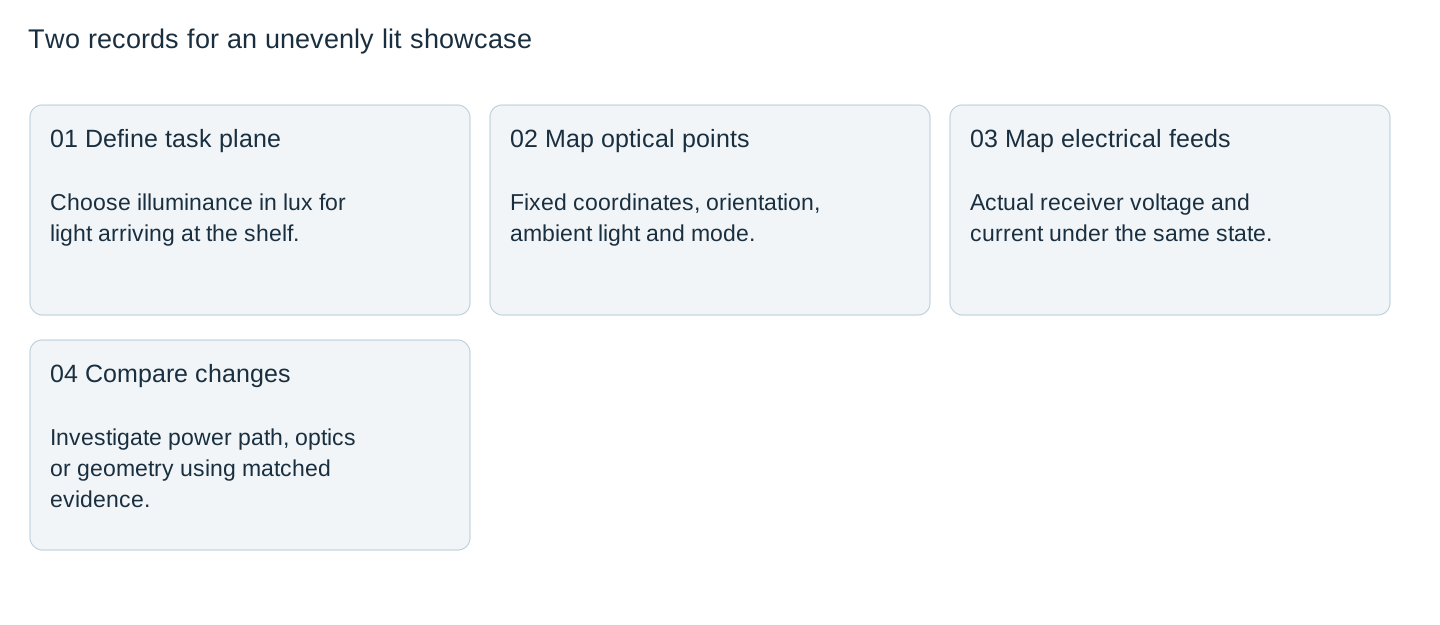
Build a repeatable grid and viewing condition
Fix measurement coordinates before trying to improve the result. Record the fixture, modules, diffuser, shelf finish, doors and nearby lighting. Place the receptor at the defined plane with a consistent orientation; avoid letting the operator shade individual points. Konica Minolta’s illuminance guidance notes why off-axis response and cosine correction matter.
Use the same grid for baseline and revised prototypes. Include relevant edges and working areas, not only convenient bright centres. A picture with marked positions is useful, but the coordinates and actual readings belong in the test record. This article prescribes no universal grid spacing or required lux value.

Keep an electrical record beside the optical map
At each defined lighting state, record source voltage, voltage at the relevant module feeds and current demand with suitable instruments. Retain module identity and controller state. A dim section that correlates with a reduced receiver voltage deserves an electrical-path investigation. A similar voltage at the compared feeds points the investigation toward other causes; it is not proof that the complete electrical system has passed.
Warm-up, dimming and colour selection should remain attributable. Check whether two measurements were taken in the same mode before treating them as a design change. Do not raise the output setting until a dark corner looks bright: other modules may exceed their permitted voltage, and the optical distribution could remain poor.
State the uniformity definition explicitly
Different ratios describe different aspects of a distribution. For six hypothetical equal-purpose grid points with 520, 480, 500, 460, 400 and 440 lx, the mean is 466.7 lx. Minimum divided by mean is approximately 0.857; minimum divided by maximum is approximately 0.769. Both calculations are correct for their stated definitions.
| Hypothetical metric | Calculation | Result |
|---|---|---|
| Mean illuminance | (520 + 480 + 500 + 460 + 400 + 440) / 6 | 466.7 lx |
| Minimum / mean | 400 / 466.6667 | 0.857 |
| Minimum / maximum | 400 / 520 | 0.769 |
These invented values are not a WEHO lighting test, a mandated standard or an acceptance threshold. The buyer must name the chosen metric, evaluated area, minimum requirements and measurement conditions. A single average can conceal the dark point; a ratio without the absolute levels can conceal a uniformly underlit display.
Use a controlled change to locate the cause
Compare the electrical and optical maps before modifying the prototype. If receiver voltage changes significantly with feed position or loading, investigate the distribution against the actual module limits. If the electrical condition is maintained but a shadow follows a shelf bracket, investigate geometry. If a diffuser revision changes the pattern, retain its revision in the optical BOM.
Change one relevant factor at a time where practical and repeat the same mapped state. Record a complete baseline before changing several items together. Otherwise an improvement cannot be attributed reliably and may be lost when production returns to a different diffuser, mounting position or module batch.
Release the evaluated assembly, not a brightness claim
Issue the final module and optics identity, mounting layout, electrical state, grid, readings, calculation definition and disposition. Identify changes that require another optical review. A supply label alone cannot guarantee showcase uniformity, and an illuminated prototype cannot resolve the WL-200-24 source-table disagreement.
For a supply enquiry, send the actual module voltage window, measured load states, distribution drawing, enclosure conditions and required electrical documents. Keep optical acceptance with the fixture’s responsible team. This division makes a dark-zone complaint actionable: the record shows whether the next investigation belongs at the power path, the controller, the luminaires or the display geometry.
Attach the illuminance grid, measurement plane, agreed ratio, module-feed voltages and controller state to your WL-200-24 enquiry. Request clarification of the photo/table output discrepancy and the offered revision’s operating limits before approving electrical capacity or optical acceptance.
Showcase electrical and illuminance comparison
| Grid point / state | Illuminance lx | Relevant receiver V | Source current A | Geometry / obstruction | Disposizione |
|---|---|---|---|---|---|
Blank project worksheet. Enter verified project data; example calculations above are not measurements.