

Line regulation measures the settled output change caused by changing the input; load regulation measures the settled output change caused by changing the load. Compare them only after aligning the input range, current range, temperature, measurement terminals, and percentage definition. A smaller number without those conditions can represent a narrower test rather than a better supply.
For an OEM buying a constant-voltage source, the useful result is an operating matrix that shows what the equipment will receive across its permitted steady states. The following 24 V example builds that matrix. Every voltage reading is hypothetical; none describes a WEHO model or a laboratory result.
Article sections
Change one variable at a time
For a line-regulation test, hold output current and the remaining conditions fixed while varying input voltage. For a load-regulation test, hold input voltage fixed while varying output current. NI explains this distinction in its power-supply regulation guide. In either case, take the comparison readings after the response has settled.
A load step produces an initial excursion and a later settled value. That excursion belongs to transient response, not automatically to the load-regulation percentage. TI’s regulator definitions distinguish these steady-state parameters from transient behavior. A meter reading after a delay cannot describe the peak that occurred during the transition.
Output setpoint error is another separate quantity. A supply sitting consistently at 24.10 V might have little change with input or load, yet still be offset from 24.00 V. Keep initial adjustment, thermal drift, dynamic excursions, and ripple and noise acceptance in their own test rows.
Write the test definition before comparing percentages
| 목 | Hypothetical comparison condition | Why it matters |
|---|---|---|
| Output and operating mode | 24.00 V nominal, constant voltage | Current limiting is outside this comparison |
| Input points | 110, 230, and 264 V AC at 50 Hz | All must be inside the candidate’s permitted range |
| Load points | 1, 4, and 8 A | 8 A must be allowed at every tested input and temperature |
| Thermal conditions | 25 °C ambient, unchanged mounting and airflow | Readings follow an agreed stabilization criterion |
| Output measurement | Same source-terminal sense points | Exclude external lead drop from the regulation result |
| Reference and units | 24.00 V nominal denominator; full observed span | A span is different from a ± deviation |
The 110–264 V matrix below assumes a hypothetical supply with a continuous input range covering all three points. It is not a test matrix for LRS-350-24. That model’s published 90–132 / 180–264 V AC ranges require a selector switch: do not combine 110 V and 230 V as one unchanged-selector run. Prepare a separate matrix for each supported selector position.
These are example project conditions, not universal test settings. Replace them with the actual permitted input, load, and environment. If one candidate needs derating at a corner, resolve that limitation before comparing its regulation percentage at a current it cannot continuously deliver.
Use a nine-point matrix to expose interaction
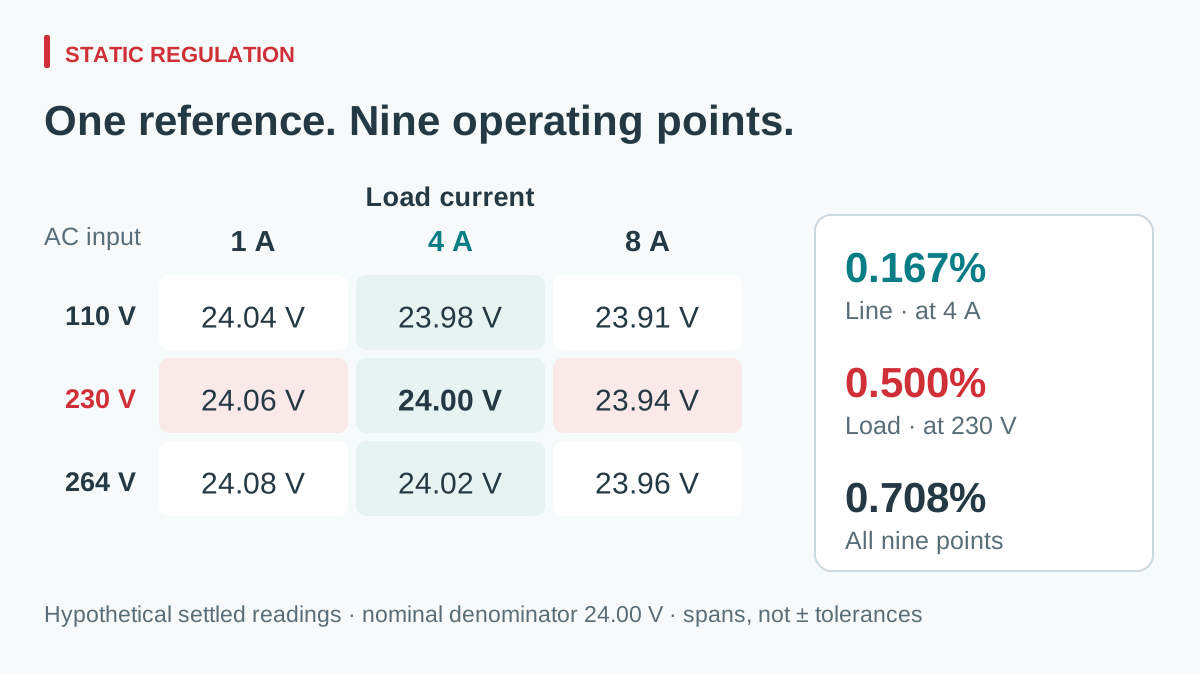
Suppose the hypothetical continuous-input sample gives the following settled source-terminal readings. The output adjustment is set once at the 230 V, 4 A reference condition, then left unchanged. Retuning at each point would erase the behavior under review.
| AC 입력 | 1 A load | 4 A load | 8 A load |
|---|---|---|---|
| 110 V | 24.04 V | 23.98 V | 23.91 V |
| 230 V | 24.06 V | 24.00 V | 23.94 V |
| 264 V | 24.08 V | 24.02 V | 23.96 V |
View full diagram ↗
Under the chosen span-based convention, calculate:
Regulation span (%) = 100 × (maximum settled output − minimum settled output) / nominal output.
- Line regulation at 4 A: 100 × (24.02 − 23.98) / 24.00 = 0.167%.
- Load regulation at 230 V: 100 × (24.06 − 23.94) / 24.00 = 0.500%.
- Observed span over all nine points: 100 × (24.08 − 23.91) / 24.00 = 0.708%.
The combined matrix span is 0.17 V. Adding the two single-axis spans gives 0.16 V, which misses this hypothetical corner interaction. Conversely, the 0.708% matrix result is not a guaranteed ±0.708% production tolerance. It is the span observed in these nine invented readings, under these conditions.
If this project’s settled source-terminal acceptance band were 23.90–24.10 V, all nine displayed values would lie within it. The lower observed margin would be only 0.01 V. Measurement uncertainty and untested temperatures could therefore change the acceptance decision; displaying three decimals in a percentage does not create extra measurement accuracy.
Normalize the definition, not just the unit symbol
A second datasheet might report line regulation in mV/V or %/V rather than total percent across a range. For the 4 A example, the 40 mV change across a 154 V input span corresponds to an average slope of 0.260 mV/V. That is a descriptive average over these endpoints, not proof of a linear response between them.
Ask what the reference voltage and endpoint conditions are before converting. A maximum deviation from a nominal value, a no-load-to-full-load difference, and a full peak-to-peak span are different definitions. Likewise, a typical figure for one sample is not interchangeable with a guaranteed maximum. Tektronix’s specification guide illustrates how percentage and absolute-voltage terms can appear together; carry every term into the comparison.
Record both suppliers’ original wording beside any normalized result. If the original data do not support an equivalent calculation, mark that comparison incomplete instead of manufacturing a common percentage.
Read the LRS-350-24 regulation fields before comparing
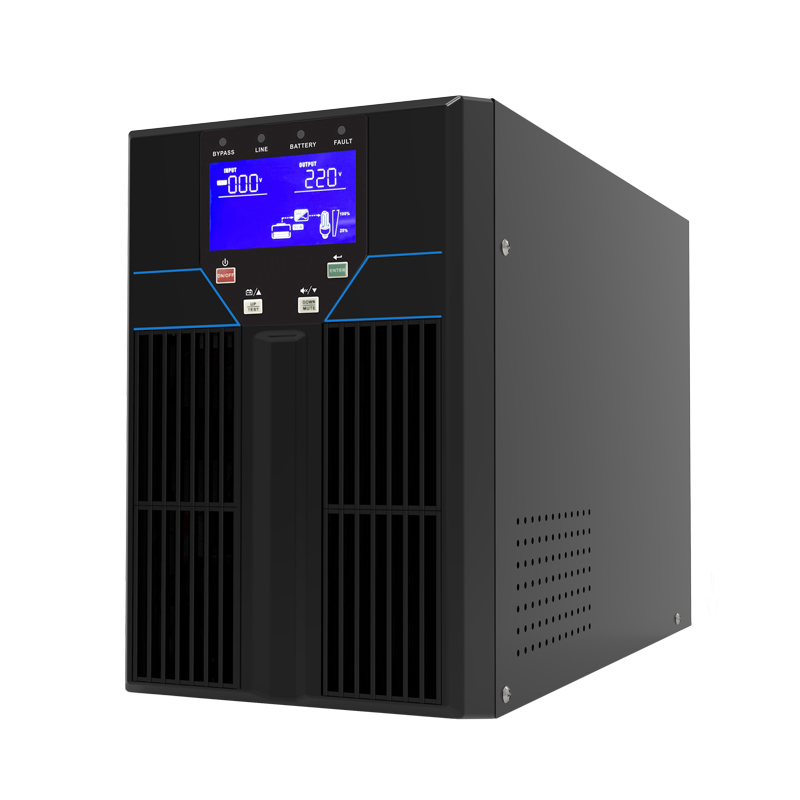
그만큼 WEHO LRS-350-24 enclosed power supply provides a practical specification-review example. In the LRS-350 specification, the 24 V model lists 0–14.6 A output, with “Inlet wire stability” and “Load stability” each shown as ±0.5%. Keep those original labels beside the proposed line- and load-regulation comparison.
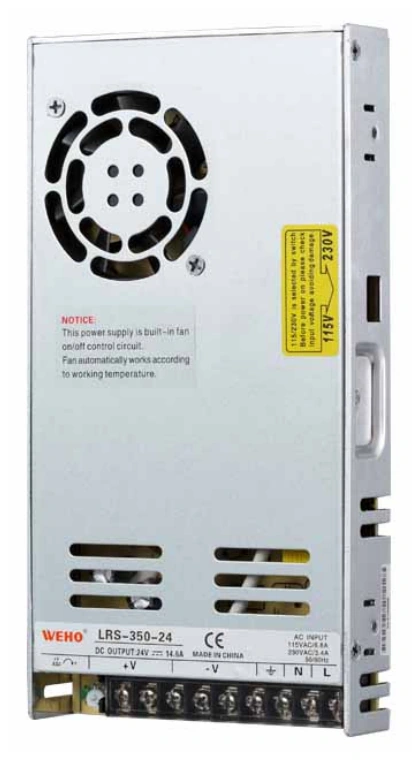
WEHO LRS-350-24 product photograph. The published regulation fields need their definitions and test conditions before comparison with another supply.
View original photograph ↗
| Published field | Comparison action |
|---|---|
| Inlet wire stability: ±0.5% | Confirm reference, input endpoints, fixed load and percentage definition |
| Load stability: ±0.5% | Confirm load endpoints, fixed input, temperature and measurement terminals |
| 90–132 / 180–264 V AC, selected by switch | Build a matrix for the selected input range and documented operating limits |
The sheet does not define enough conditions to equate its ±0.5% entries with the hypothetical matrix’s 0.500% full-span result. Also, 110 V and 230 V belong to different published selector ranges; they cannot be treated as test points under one unchanged selector setting. Ask for the applicable definitions and prepare separate range-specific records before comparing this candidate with another supply.
Make the measurement repeatable
- Define the allowed envelope. List permitted input, frequency, load, ambient temperature, mounting, and any required warm-up or minimum load. Use suitable equipment and the manufacturer’s connection procedure.
- Separate force and sense connections. Measure at the agreed output terminals with a calibrated meter and controlled contact points. Record the load current independently. Remote sense, if available, requires its documented connection and compensation limits.
- Set one reference. Log adjustment position and reference reading. Do not readjust during the matrix. Keep current limiting, protection operation, and source distortion out of an ordinary steady-state comparison.
- Use a settling criterion. For example, an agreed maximum drift over a defined observation interval is more reproducible than “wait a while.” Select the criterion for the instrument resolution and thermal behavior; it is not a universal number.
- Repeat the reference at the end. A shifted final reference may reveal heating or contact drift. Repeat suspicious points in reverse order before attributing every difference to input or load.
- Apply the decision rule. Retain unrounded readings and the measurement uncertainty relevant to the chosen limit. For batch acceptance, define sample count and production limits separately from this engineering sample matrix.
After establishing source-terminal behavior, use a separate load-side voltage budget for the installed equipment. Mixing cable losses into the regulation table makes the supply and the wiring impossible to evaluate independently.
Turn the result into a comparable supplier request
Send WEHO your regulation comparison matrix with the input and load ranges, temperature conditions, terminal measurement location, required settled band, and the intended percentage definition. Identify which figures must be guaranteed and which sample tests will support qualification.
The useful selection record contains the original specifications, normalized calculations, operating-corner readings, and an agreed acceptance rule. That record lets procurement compare the same electrical task when price, model suffix, or a proposed substitute changes.