

Power supply switching frequency is an interface parameter, not a standalone noise rating. A converter may switch far above the equipment’s signal band and still create an in-band error through sampling, modulation, or coupling. Choose a candidate by its documented frequency behavior and by measurements at the receiving circuit.
For an OEM integrating industrial power with a sensor, data-acquisition board, or precision controller, the first deliverable should be a frequency review sheet: protected signal bands, receiver clocks, supply operating modes, and test conditions. That sheet makes a supplier discussion more useful than a request for “the highest-frequency supply.” Use an exact assembly document as the starting point, then confirm its applicability and system behavior before qualification.
Article sections
Collect more than the nominal switching frequency
Start with the exact converter version and its operating envelope. Determine whether frequency is fixed, variable with input or load, externally synchronized, or intentionally spread over a range. Include tolerances and the transition to any light-load or standby mode. A single full-load reading cannot characterize the entire application.
TI’s power-module noise article describes frequency variation and the beat behavior of multiple converters. It also explains that synchronization is an implemented feature of particular devices. An enclosed industrial supply without a documented synchronization interface cannot be treated like an adjustable board-level regulator.
High switching frequency can support different component and packaging choices, but it does not rank complete assemblies by interference performance. Fast edges, layout, parasitic paths, shielding, and the receiving circuit affect the result. Harmonic content extends beyond the fundamental, and a spectrum taken in one load state may omit a mode used during normal production.
Define the receiving equipment’s protected bands
| Receiver information | What to record | Decision it supports |
|---|---|---|
| Wanted signal | Frequency band and allowed error or spur amplitude | Where interference actually matters |
| Sampling system | ADC architecture, sample or modulator clocks, decimation, and operating rates | Which frequencies may fold into the result |
| Power sensitivity | Relevant supply-rejection or measured coupling versus frequency | Whether a rail tone can reach the measurement |
| Other converters | Actual frequencies, tolerances, and load states | Potential low-frequency beat products |
| Physical interfaces | Rail, return, chassis, shield, and cable arrangement | Which coupling paths the test must preserve |
Choose limits at the function the equipment must perform: measurement error, an unwanted spectral line, communication failures, or control instability. A low millivolt ripple number at the supply output does not establish those limits. Use a separate source and receiving-circuit ripple acceptance method when specifying the voltage measurement itself.
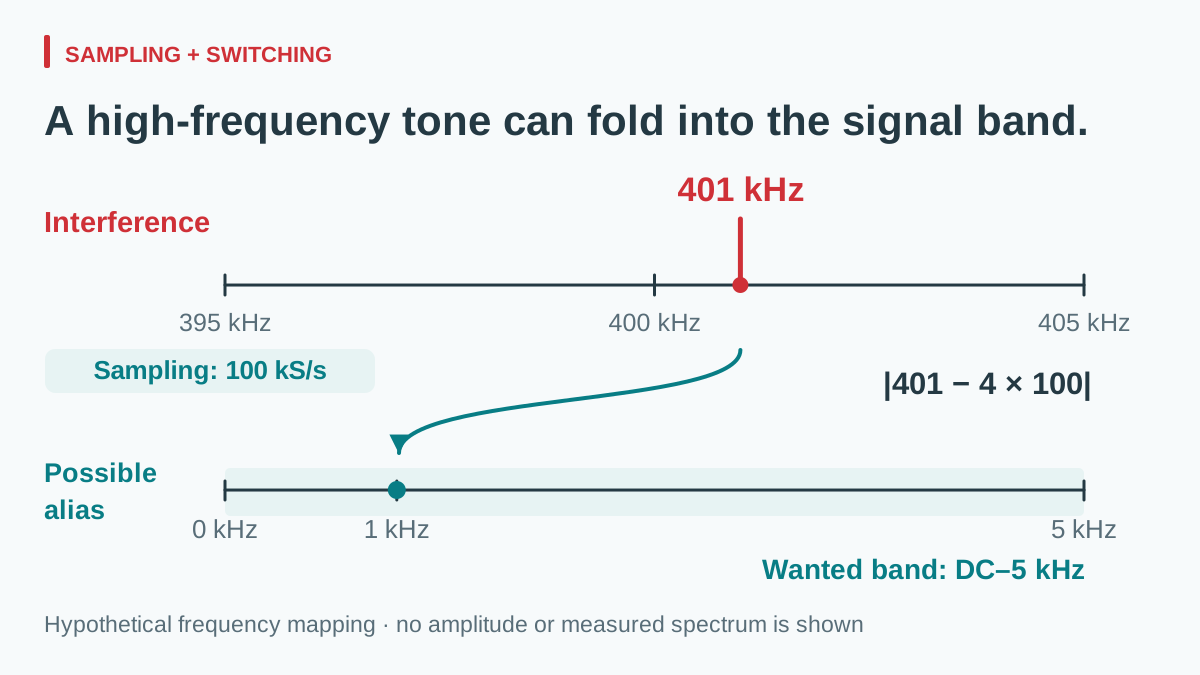
A 401 kHz tone can appear at 1 kHz
Consider a hypothetical uniformly sampled receiver at 100 kS/s with a wanted band from DC to 5 kHz. Assume, solely for screening, that a 401 kHz interference tone reaches the sampling input after the actual analog attenuation. The nearest multiple of the sample rate is 400 kHz:
falias = mink∈integers |finterference − kfsample| = |401 − 4 × 100| = 1 kHz.
View full diagram ↗
The possible alias lies inside the wanted band. This predicts a frequency location, not its amplitude. If the analog path sufficiently attenuates the tone, the equipment may still meet its requirement. If coupling occurs through another internal path, the simple input-sampling model may be incomplete.
Now let that interference frequency range from 393 to 409 kHz across the application envelope. Relative to the 400 kHz multiple, the possible alias sweeps through DC to 9 kHz. The 395–405 kHz part of the interval can map into the 0–5 kHz wanted band. Evaluating only the nominal 401 kHz point would miss the crossing through DC and the rest of that range.
A delta-sigma converter requires its own modulator and digital-filter analysis. Its output data rate is not automatically the sampling frequency to insert in this simple example. TI’s ADC supply-rejection discussion shows why converter clock and filter behavior matter; use the exact receiver documentation before selecting a supposedly safe frequency.
Check nearby converters and light-load modes
Two hypothetical regulators operating at 400 and 412 kHz have a difference frequency of 12 kHz. If coupling and nonlinear or modulation mechanisms create a beat component, that lower frequency can become relevant to the system. Merely finding the arithmetic difference does not prove that a damaging tone exists; inspect the receiving signal and correlate it with operating states.
TI compares supported synchronization strategies in a measured power tree. Such a scheme may remove an uncontrolled frequency difference, but it brings clock-range, startup, phase, and load requirements. Synchronizing every regulator in phase can also align pulse-current demand. These are design choices for devices that support them, not permission to connect an external clock to an undocumented terminal.
Similarly, a light-load burst or pulse-skipping mode can create a spectrum unlike the steady-load case; TI documents pulse-skipping behavior for the TPS61175, without making it a rule for every converter. Record idle, standby, minimum load, and the transitions used by the equipment. This review concerns electrical interference; audible buzzing has a separate diagnostic method.
Read an SD-50 frequency disclosure before testing
ที่ WEHO SD-50 DC-DC converter product page provides a concrete starting point for a supplier review. The SD-50 manufacturer specification lists a fixed 83 kHz switching frequency in its feature list and the same oscillator value in its block diagram. Record 83 kHz as a published document value, not a confirmed measurement of the pictured hardware.
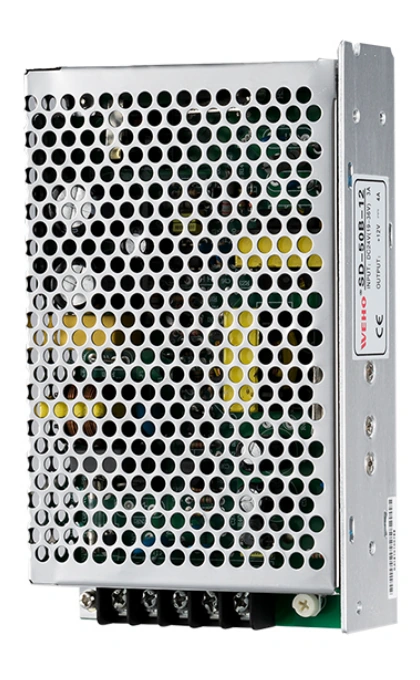
SD-50B-12 product photograph for model identification. Check the applicable SD-50 document revision before using its frequency disclosure in the system review.
View original photograph ↗
The public SD-50 records and the pictured SD-50B-12 unit’s rating label are not fully aligned. Do not transfer the PDF’s 83 kHz frequency, block diagram, or withstand and isolation figures to that unit until WEHO confirms revision-matched documentation. Request the applicable frequency tolerance and operating-mode behavior for the exact supplied suffix and hardware revision. The PDF does not establish a permitted external synchronization interface.
Compare the revision-confirmed fundamental and harmonics with the receiver clocks, then measure relevant spurs at the receiving circuit over the required input and load states. The 401 kHz calculation above is a separate hypothetical example; it is not the stated SD-50 frequency or a measurement of this product.
Run a controlled compatibility test
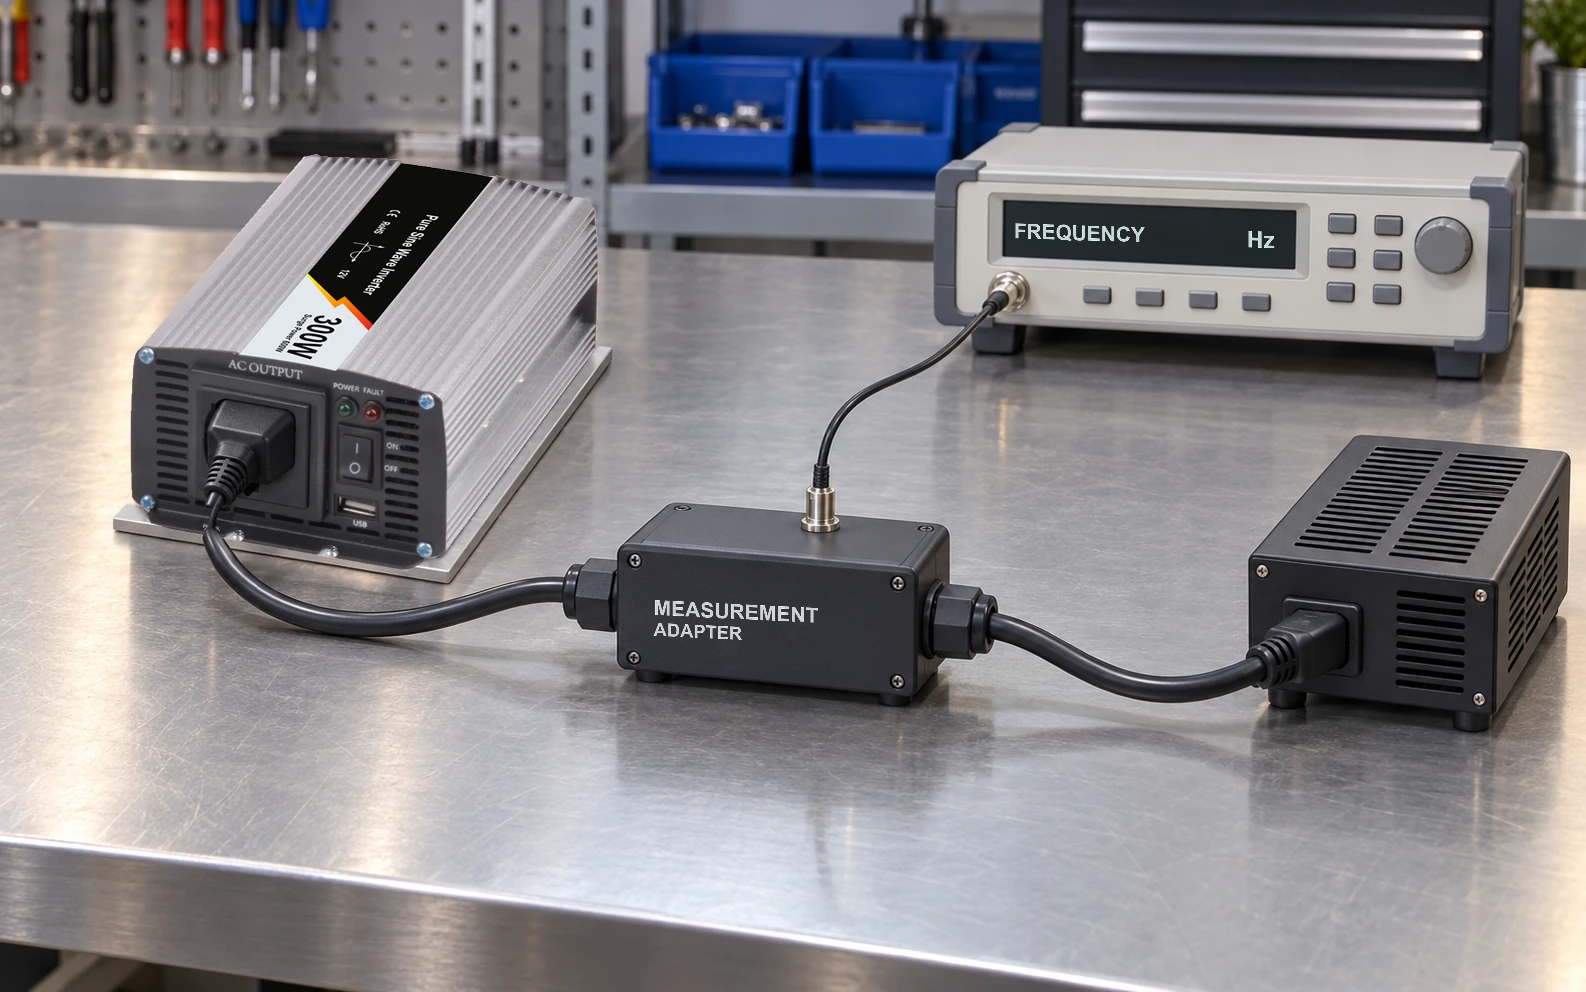
Test the final interconnection, not a supply on an unrelated bench load. Record hardware revisions, cable lengths, grounding, enclosure state, receiver clock settings, ambient temperature, and input/load points. Use suitable isolated or differential measurement equipment and permitted connection methods; instrument grounds must not create a new return path.
| Test condition | Observe at the receiver | Keep in the record |
|---|---|---|
| Nominal input and normal load | Baseline error and spectral lines | Supply spectrum and receiver configuration |
| Minimum/maximum permitted input | Movement or growth of relevant spurs | Actual frequency interval, not nominal label alone |
| Idle and lowest continuous load | Burst envelopes, drift, or periodic interference | Mode transitions and observation time |
| Each supported sampling rate | Aliases moving with clock changes | Analysis bandwidth, window, and frequency resolution |
| Other regulators enabled separately and together | New difference components or state-dependent errors | Individual and combined operating frequencies |
A useful diagnostic change alters one variable at a time. Moving a supported receiver clock and seeing an unwanted line move as predicted strengthens an alias hypothesis. Changing supply frequency is legitimate only where the hardware permits it. Preserve the same load and wiring, and recheck electrical and thermal behavior after a change.
Make the decision from system evidence
Accept the interface when the equipment meets its stated error and interference limits throughout the agreed states, with a reproducible setup and remaining margin. If one state fails, identify whether the next action is a different supply behavior, receiver rejection, layout change, clock plan, or documented local regulation.
An extra input filter is a separate design decision: adding capacitance can change a converter’s dynamic interaction. Review input-filter resonance and source impedance before treating an arbitrary filter as the universal fix.
Send WEHO your sensitive-load interface requirements, including the receiver’s protected band, clocks, input/load envelope, grounding arrangement, and the evidence needed for qualification. Ask for frequency and operating-mode information for the exact proposed assembly. A clear test record gives purchasing a defensible basis for reviewing a later substitution.