

- Pt100 and JPt100 can both measure 100 Ω at 0°C while requiring different resistance-to-temperature curves.
- A correct ice-point reading cannot establish compatibility across the operating range.
- Match the probe curve, controller input selection and applicable instructions before replacing an RTD.
- The current TX4 manual lists Pt100 and Cu50; JPt100 compatibility requires separate confirmation.
Why a replacement probe can pass one check and fail in service
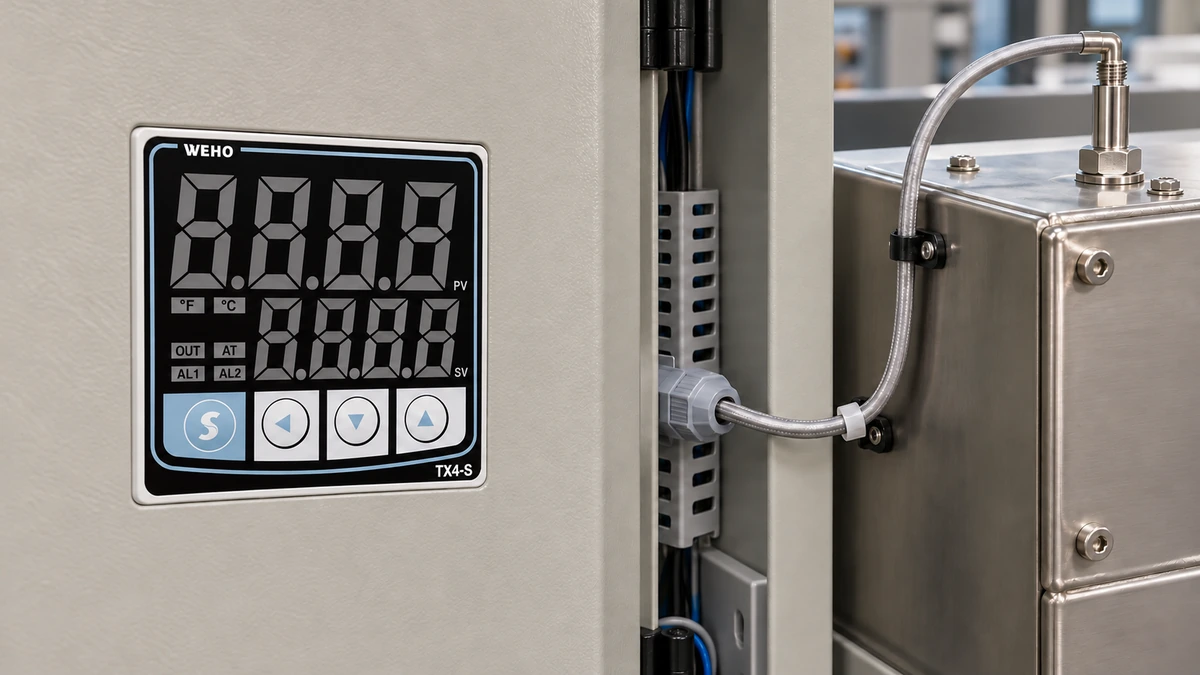
A maintenance team replaces a legacy platinum probe, checks 100 Ω at 0°C and releases the machine. The display later disagrees with a reference at the production temperature, although the wiring appears unchanged. Before applying an offset, determine whether the replacement sensor and controller use the same resistance curve.
দ TX4-S controller input reference identifies the controller family involved in this review. Product appearance does not establish support for every platinum-sensor curve, and a three-wire connection does not resolve a curve mismatch.
Identify the curve separately from nominal resistance
Pt100 describes a platinum RTD with a nominal resistance of 100 Ω at 0°C, but nominal resistance alone is incomplete identification. OMRON's JPt100 definition distinguishes the legacy Japanese characteristic from IEC-associated Pt100. The sensor certificate or manufacturer curve must establish which characteristic applies.
A supplier description such as “100-ohm platinum, three wire” leaves the resistance law unresolved. Request the curve designation, relevant coefficients or resistance table, usable temperature range and tolerance information. Record the complete probe part number rather than assuming a familiar connector or cable color identifies the element.
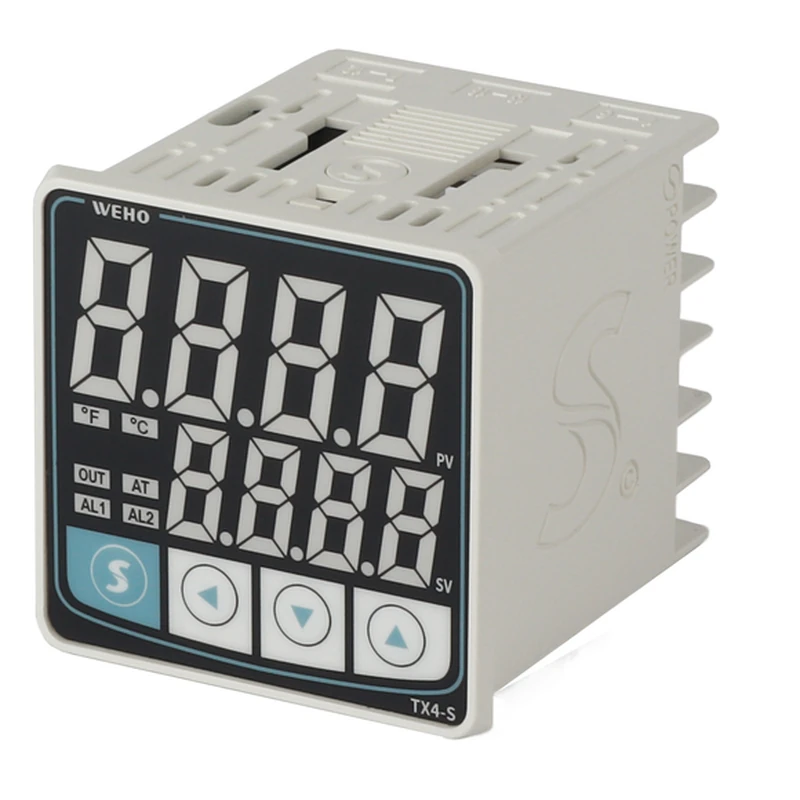
দ WEHO TX4 series instruction manual identifies Pt100 and Cu50 in its RTD input list. The listed inputs do not provide evidence that every TX4 configuration accepts JPt100. Obtain the applicable ordered-unit instructions before approving an older JPt probe or an external conversion arrangement.
Input configuration and calibration also perform different jobs. Configuration selects the resistance law that converts the measured resistance into temperature; calibration checks the resulting measurement against a reference under stated conditions. A calibration offset cannot make two different resistance laws identical across a range.
Calculate a hypothetical two-curve mismatch
This engineering example compares ideal reference curves above 0°C, with zero lead resistance and no self-heating. It is not a measured TX4 error, an actual probe calibration or an approved replacement specification. The comparison isolates curve identity so that other uncertainty sources do not hide its effect.
For temperatures at or above 0°C, use R(T) = R₀ × (1 + A × T + B × T²). Here R is in ohms, T is in degrees Celsius and R₀ = 100 Ω. NI's RTD configuration documentation lists separate coefficient sets for the common IEC-associated and JISC 1604 characteristics.
For this calculation, curve P uses A = 0.0039083°C⁻¹ and B = −0.0000005775°C⁻². Curve J uses A = 0.0039739°C⁻¹ and B = −0.0000005870°C⁻². These are reference-curve inputs; they are not measured coefficients of the installed probe.
At 100°C, curve P gives 100 × (1 + 0.39083 − 0.005775) = 138.5055 Ω. Curve J gives 100 × (1 + 0.39739 − 0.005870) = 139.1520 Ω. Both begin at 100 Ω, but the resistance difference at this point is 0.6465 Ω.
To estimate what the wrong conversion would report, insert 139.1520 Ω into curve P and solve its quadratic for temperature. The positive operating-range solution is approximately 101.70°C, creating a calculated indication difference of about +1.70°C at this example's true 100°C point. The difference belongs to the mismatched reference curves, not a claimed controller accuracy limit.
At 200°C, curve P gives 175.8560 Ω and curve J gives 177.1300 Ω. Interpreting the second resistance with curve P gives approximately 203.47°C. A single negative correction established at 100°C would therefore leave a different residual at 200°C.
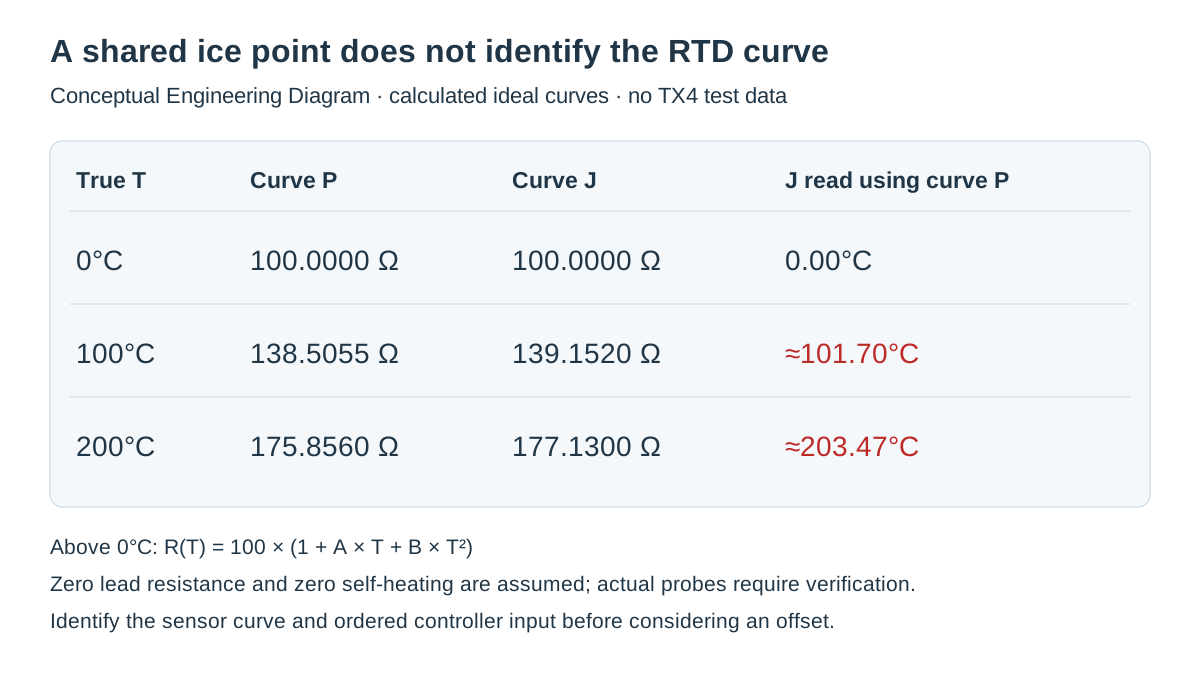
Swipe horizontally on a small screen, or open the full-size diagram.
Use a curve-verification record before changing offsets
The useful output is a documented conversion decision, not a rule that one sensor type is better. NI's RTD measurement guidance explains that accurate resistance conversion uses the relevant curve rather than nominal resistance alone. Choose verification points that cover the actual production range.
| True temperature | Curve P resistance | Curve J resistance | J resistance through P conversion |
|---|---|---|---|
| 0°C | 100.0000 Ω | 100.0000 Ω | 0.00°C |
| 100°C | 138.5055 Ω | 139.1520 Ω | About 101.70°C |
| 200°C | 175.8560 Ω | 177.1300 Ω | About 203.47°C |
A near-zero error at the first row would not validate the remaining rows. Conversely, a growing error with temperature is not proof of curve mismatch by itself; wiring, immersion, reference uncertainty and sensor condition can produce other patterns. Use the record to distinguish hypotheses rather than assigning a cause from one reading.
দ TX4-S thermocouple measurement-chain article addresses another input technology. Its broader lesson is to qualify the complete sensor-to-controller chain, while keeping thermocouple compensation and RTD curve identification as separate technical tasks.
Verify the installed chain under controlled conditions
- Identify both parts. Record the probe part number, controller's complete label and current input selection. Compare them with the applicable probe curve and controller input documentation; an undocumented JPt setting remains unresolved rather than assumed available.
- Define comparison points. Record the operating range, selected verification temperatures and required project tolerance. Choose points that can reveal a changing curve error; a single 0°C resistance check only tests the common nominal point.
- Separate electronics from the probe. Where the equipment procedure permits, a qualified person can use a suitable resistance simulator with the heating circuit controlled independently. Record simulated resistances, input selection and displayed values, then compare the expected curve conversion without implying that simulator agreement validates probe immersion.
- Check the assembled sensor chain. Record reference instrument identity, immersion arrangement, stabilized readings and lead configuration. Judge results against the project uncertainty budget and approved acceptance procedure, not against the illustrative differences in this article.
- Freeze the accepted configuration. Record the approved probe code, input type, any justified correction and the verification result. Release purchasing and commissioning records together so that a later nominally equivalent spare cannot silently introduce another curve.
A failed compatibility check should stop the replacement decision, not invite trial-and-error input selection on operating equipment. Changing input type can change the displayed temperature and control demand immediately. Follow the equipment's isolation and commissioning procedures before reconnecting the production loop.
When a correction is justified after curve compatibility is established, document its purpose and tested range. A local installation bias, an electronic input correction and a curve mismatch require different remedies. Keeping those explanations separate prevents an apparently successful adjustment from hiding the wrong sensor identity.
Send WEHO the curve evidence with the controller enquiry
Use the TX4-S configuration enquiry page with the complete ordered-unit label, probe part number, curve designation, production range and required accuracy. Include the comparison record and ask which documented input arrangement applies. If JPt100 is required, request explicit compatibility confirmation rather than treating a Pt100 menu entry as equivalent.
Engineering FAQ
Can a 100 Ω reading at 0°C distinguish Pt100 from JPt100?
No, both characteristics can share that nominal resistance at 0°C. Identify the curve from the probe documentation and verify additional points within the intended range. The common nominal point cannot establish interchangeability.
Can I correct a wrong RTD curve with one display offset?
A single offset cannot generally correct a curve mismatch across the range. The example's difference changes between 100°C and 200°C. Establish curve compatibility before deciding whether a remaining installation bias warrants a documented correction.
Does three-wire RTD wiring identify the temperature curve?
No, three-wire wiring concerns the measurement connection rather than the resistance law. The input still needs the correct sensor characteristic, and unequal lead effects require their own assessment. Record wiring and curve identity separately.
Does the TX4-S product name confirm JPt100 support?
No, the product name alone does not confirm JPt100 support. The cited TX4 manual lists Pt100 and Cu50 RTD inputs, so a JPt100 requirement needs applicable-unit evidence. Submit the complete controller and probe identification before approving replacement.