

Measure LED strip watts per metre at a defined voltage, active length, temperature and operating state. A lower reading caused by voltage loss in a reel or test leads is not evidence that the same strip will draw that little after the final installation improves its power distribution. For a lighting OEM, the useful output is a repeatable sample record, not a single current reading beside a roll of tape.
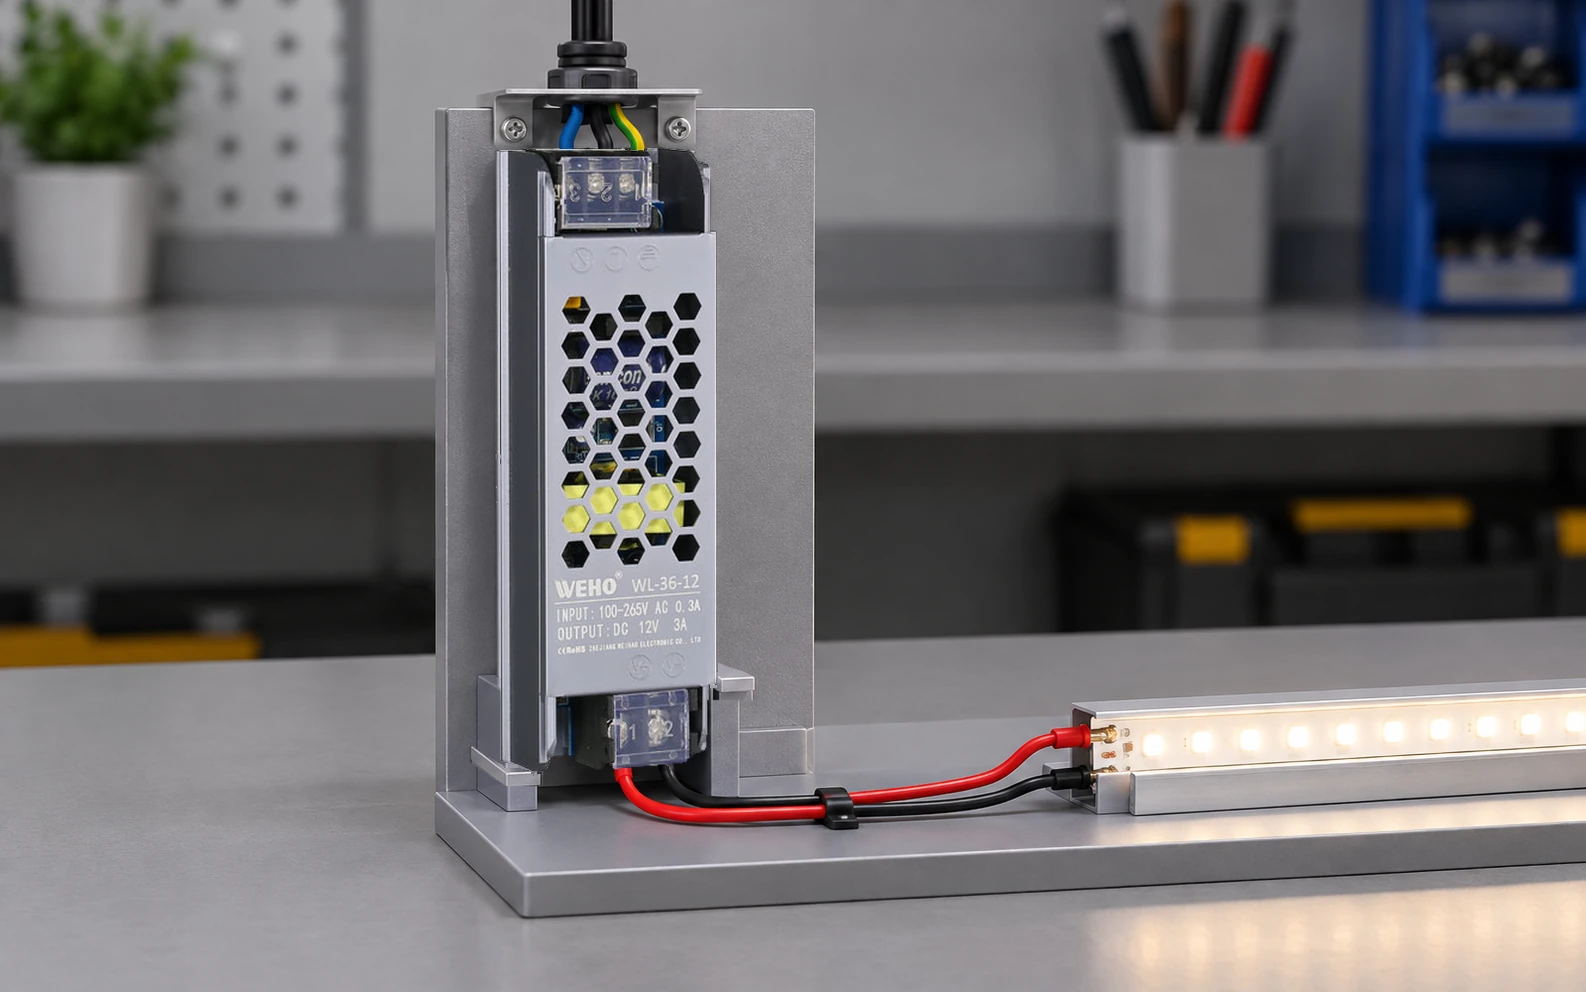
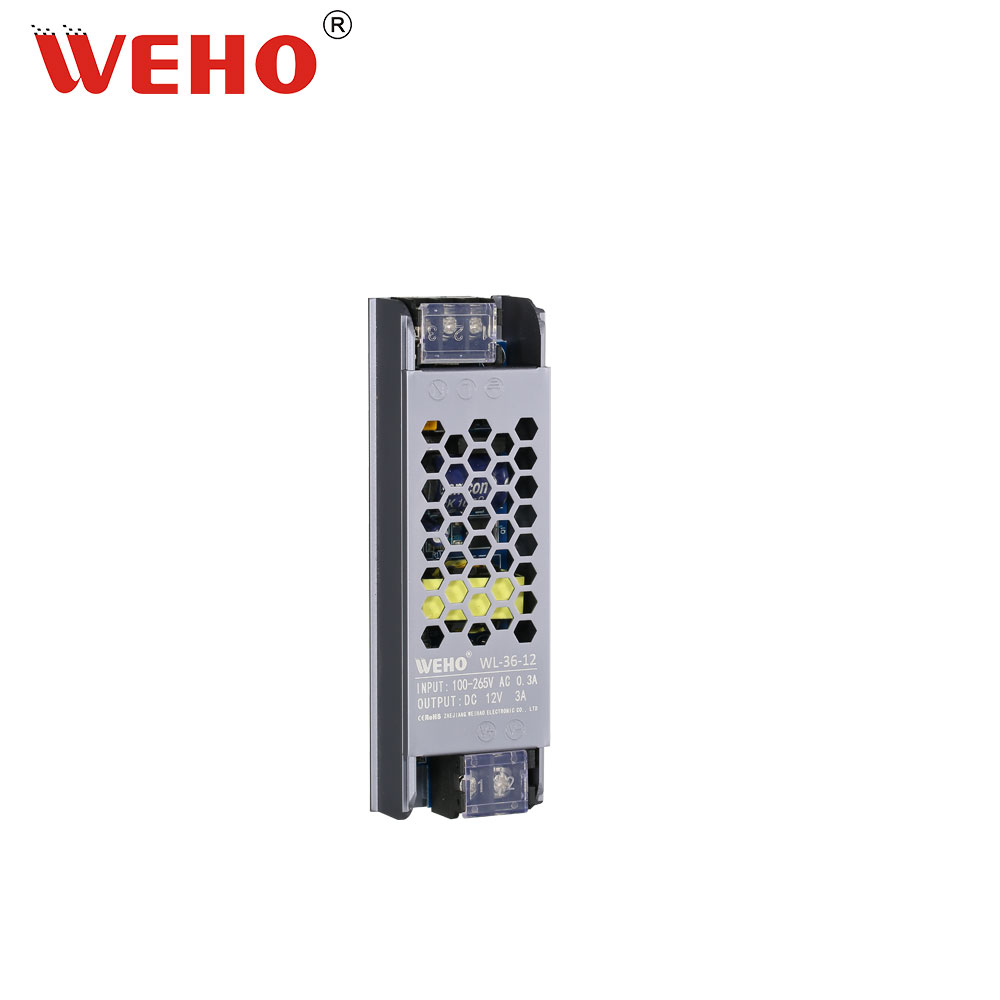
The photographed WEHO WL-36-12 is a concrete 12 V source reference. Its label reads 12 V, 3 A; those markings identify the unit and do not establish a tested load allowance for a particular strip. The method below characterizes the receiver before the final supply and installation are approved.
Define what one metre represents
Record the strip manufacturer, product code, revision, colour or colour-temperature option, density and accepted cut increments. Measure active illuminated length consistently. A short piece with connector tails is not automatically the same electrical sample as an unopened reel. Keep any stated consumption tolerance and the conditions behind the supplier’s W/m figure.
Choose a specimen and feed arrangement that represent the question being answered. A short specimen can characterize local demand without a long copper trace starving the distant LEDs. A full intended run is also needed to evaluate the actual installation. They serve different purposes and should have different record rows. Neither result should be substituted silently for the other.
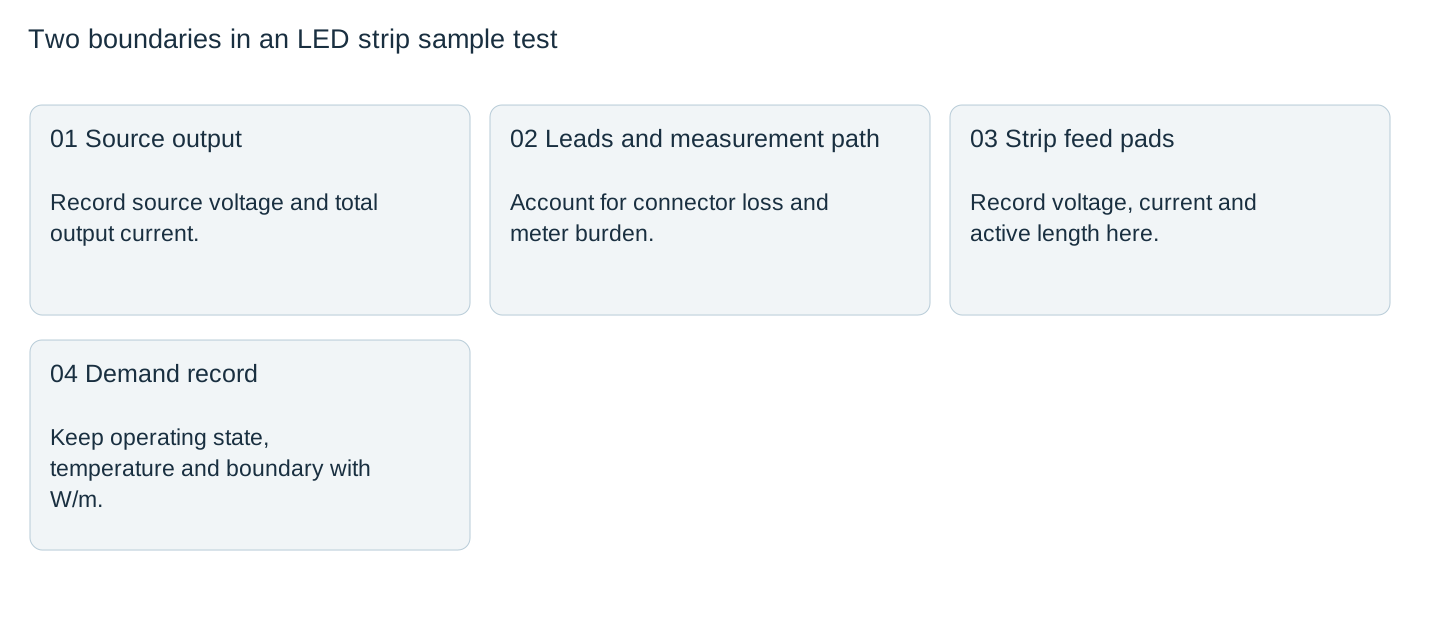
Measure voltage at the strip input
Record both source-terminal voltage and voltage at the strip feed pads under load. Waveform Lighting’s voltage-drop explanation shows why voltage declines along a strip. External test leads, connectors and a series current meter can add further loss before the strip begins.
If two suppliers’ samples are compared at different feed-pad voltages, their current readings are not a controlled comparison. Use an appropriate documented test arrangement to establish the intended voltage at the receiver while staying within its limits. Do not raise an installed supply arbitrarily to compensate for a long run; nearer modules could then receive too much voltage.

Keep receiver power and source power separate
For steady DC, multiply the voltage at the stated boundary by current through that boundary. Divide by the agreed active length. Record whether connectors, controller electronics and distribution losses are included. A value measured at the supply output is useful for the supply budget, but it is not necessarily the strip’s own watts per metre.
| Hypothetical steady-DC sample | Calculation | Meaning |
|---|---|---|
| 1.00 m, 12.00 V at strip, 0.90 A | 12.00 × 0.90 / 1.00 = 10.8 W/m | Receiver demand at that specified condition |
| Same length, 11.40 V at strip, 0.78 A | 11.40 × 0.78 / 1.00 = 8.892 W/m | A different operating point; not a lower 12 V rating |
| 12.00 V at source, 0.78 A | 9.36 W at source output | Includes the losses before the lower-voltage receiver |
These numbers are invented arithmetic examples, not WL-36 or strip test results. They illustrate why averaging the two W/m values would be meaningless. The different current is an assumed observation; it is not predicted from a universal LED formula.
Ensure the measurement does not change the answer
A series ammeter introduces burden voltage. Keysight’s DC-current measurement tutorial explains this source of disturbance. Check the instrument range, permissible current and actual effect on the circuit. A higher-resolution range can be less suitable if its insertion loss changes the operating point being compared.
For PWM or addressable lighting, a slow current indication may hide switching peaks or changing content. Specify the controller mode and measurement bandwidth needed for the question. Steady V × I is not a substitute for time-aligned power measurement when voltage and current vary materially. Characterize full permitted output separately from a convenient dimmed display.
Repeat states that could change the purchasing decision
Keep strip mounting, diffuser, ambient conditions and warm-up state attributable. Compare repeat specimens or lots when the production specification requires it. Do not extrapolate a measured sample into an unsupported manufacturing tolerance.
Separate the stabilized full-output record from turn-on demand and any programmed animation. If warm-up changes current, retain the trend and the time criterion used to decide the reading has stabilized. A visually bright strip or a cool-looking photograph cannot supply those measurements.
Turn the result into a load specification
Issue a receiver-demand record containing the actual tested configuration, conditions, uncertainty and allowed production variation. Then add controller consumption, distribution losses, permitted combinations and transient requirements to the source-selection work. Check the selected supply’s available output under the real installation conditions; do not impose an unexplained universal percentage.
For WL-36-12, keep the exact 12 V identity and request the offered revision’s installation and operating limits. The public page contains inconsistent efficiency statements, so they are not used here to calculate input power or a thermal allowance. A useful RFQ includes the strip test record, final feed layout, enclosure and required operating states. The buyer can then distinguish a verified receiver demand from an estimate and identify which remaining sample checks actually matter.
Include the strip part number, active sample length, feed-pad voltage, current trace, warm-up criterion and intended feed layout in your WL-36-12 enquiry. Ask WEHO for the offered revision’s installed output limits so the measured strip-demand record can support supply selection.
LED strip sample consumption record
| Sample / state | V at source | V at strip | Current A | Active length m | Receiver W/m | Disposizione |
|---|---|---|---|---|---|---|
Blank project worksheet. Enter verified project data; example calculations above are not measurements.